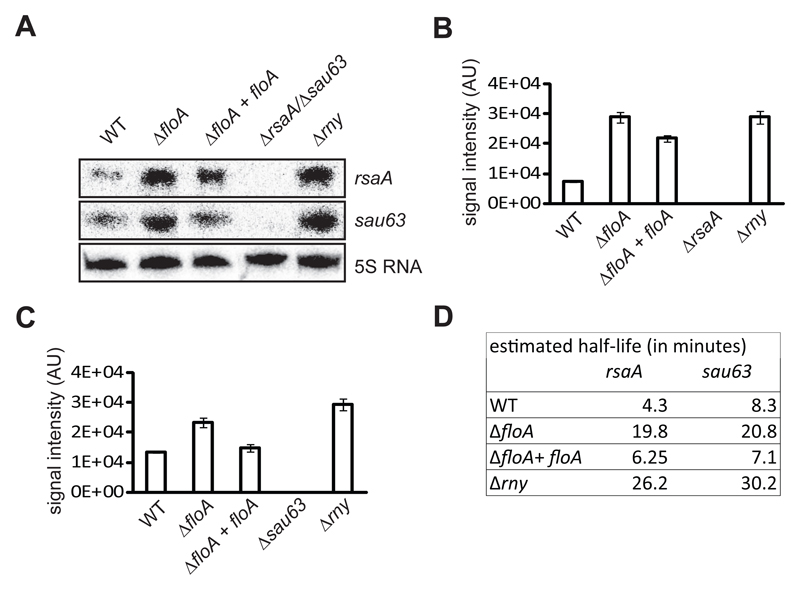
Figure 3. rsaA and sau63 transcripts are more abundant in the ΔfloA mutant.
(A) Northern blot analysis of rsaA and sau63 expression on distinct genetic backgrounds. RNA was hybridized with probes specific for rsaA (top) and sau63 (center). 5S rRNA detection is indicated as loading control (bottom). (B) Relative amounts of rsaA transcripts determined by quantification of signal intensity (arbitrary units, AU). (C) Relative amounts of sau63 transcripts determined by quantification of signal intensity. (D) Northern blot analysis of half-life of rsaA and sau63 transcripts on distinct genetic backgrounds. Transcript stability is measured over time (minutes) after rifampicin treatment.

