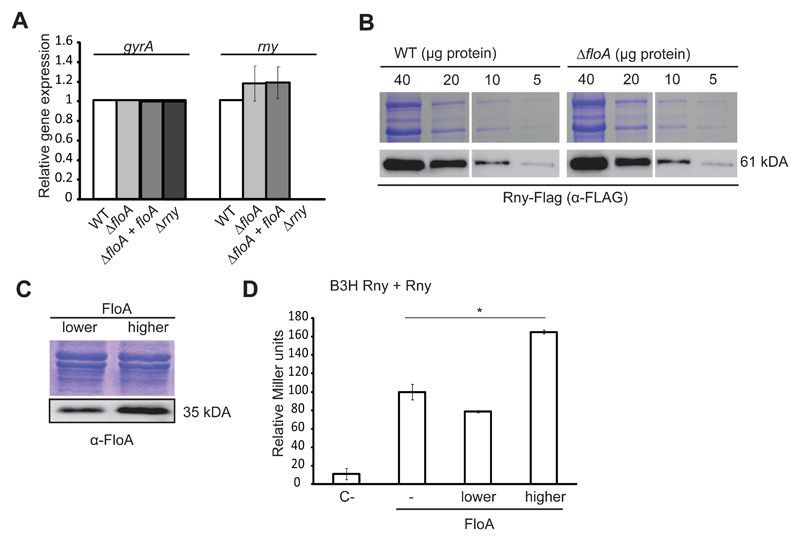
Figure 4. Absence of FloA does not affect Rny transcription and translation levels.
(A) qRT-PCR analysis of expression of rny on distinct genetic backgrounds (Student’s t-test, p ≤0.05). gyrA expression is used as a reference. (B) Immunodetection of Rny-Flag in gradually diluted samples of WT strain and ΔfloA mutant. Top, Coomassie-stained gel; bottom, immunoblot. (C) BTH assay to quantify the Rny interaction at distinct FloA concentrations. Low- (pSEVA631) and high-copy (pSEVA641) plasmids expressing FloA rendered lower and higher concentrations of FloA in immunoblot analysis (bottom). SDS-PAGE shown for the loading control. (D) Graph showing β-galactosidase activity of the B3H strains (in Miller Units). C- is the negative control strain bearing empty plasmids. Rny-Rny interaction in the absence of FloA (–), or at lower or higher FloA concentrations. Significance was measured by one-way ANOVA. * p <0.05. Data shown as mean ± SD of three independent biological replicates (n = 3). Each biological replicate included three technical replicates.

