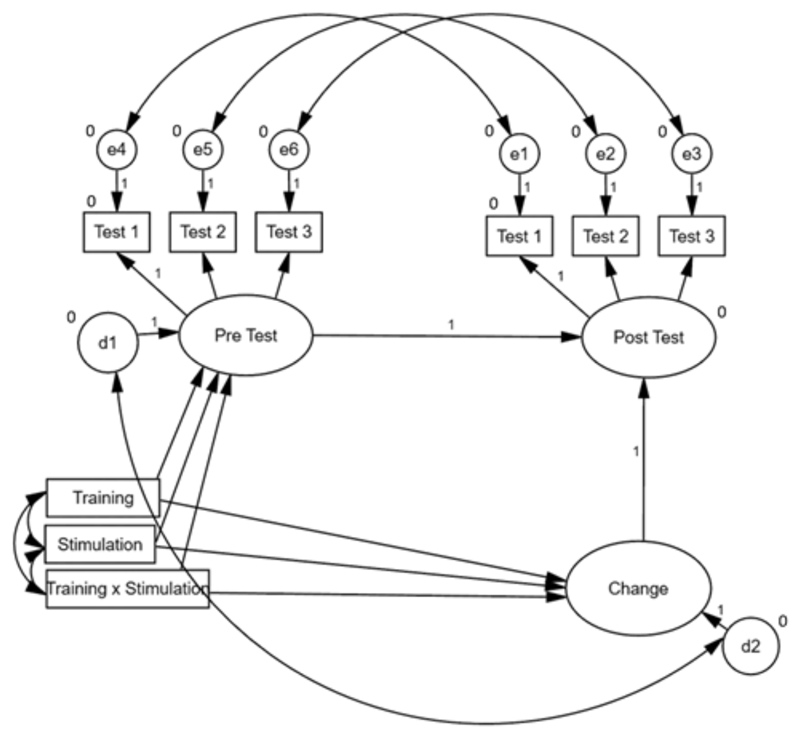
Figure 1.
Graphical representation of the latent change score model used to assess effects of training, stimulation, and their interaction on cognitive performance. Observed variables are represented by squares, latent variables by ellipses, and residuals by circles. e1-e6 represent the residual of the observed variables (error terms), and d1-d2 represent the residual of the latent variables for pretest and change (disturbance terms). Regression weights are represented by 1-headed arrows and covariances by 2-headed arrows. Regression weights marked with ones were restricted to 1. For variables marked with zeros, intercepts were restricted to equal 0. All other regression weights, covariances, and intercepts were estimated.

