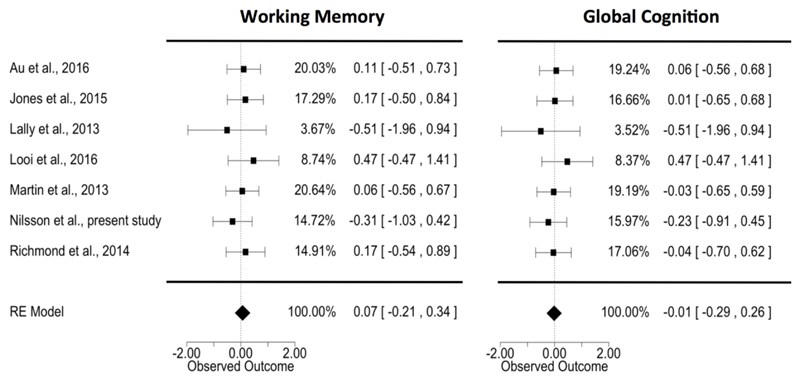
Figure 3.
Forest plots showing the individual observed effect sizes with corresponding confidence intervals for working memory performance (a) and global cognitive performance (b). The column with percentages contains the inverse variance weights. The polygon shows the summary estimate based on the random effects model; its outer edges indicate the confidence interval limits.

