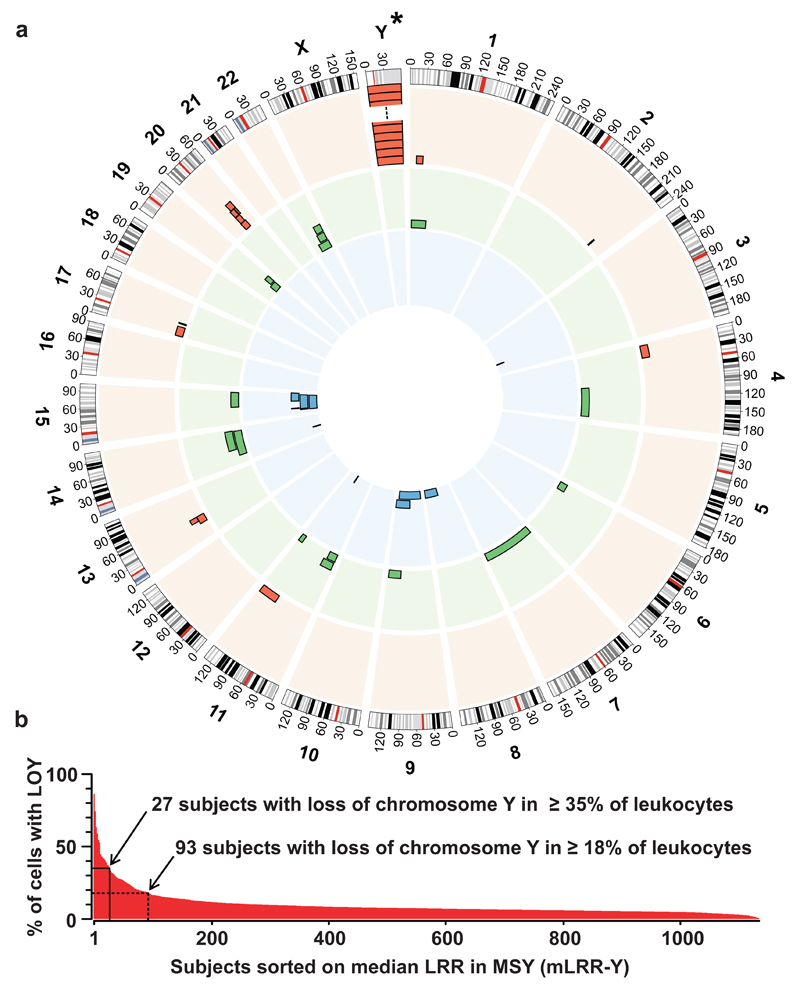
Figure 1.
Structural genetic variants found in phenotypically normal blood cells from 1141 elderly men with no prior record of haematological malignancy. Circular-plot in panel a shows position and frequency of 40 autosomal variants including 13 deletions (red outer circle), 16 CNNLOH regions (green middle circle) and 11 gains (blue inner circle). The asterisk (*) above chromosome Y in panel a indicates that the frequency of loss of chromosome Y (LOY) is not shown to scale with the autosomal variants in panel a. Panel b shows the frequency of LOY, with the percentage of cells affected in each participant, plotted on the y-axis after sorting subjects with descending mLRR-Y, i.e. the median Log R Ratio (LRR) for ~2560 SNP-probes in the male specific region of chromosome Y (MSY) (chrY:2694521-59034049, hg19/GRCh37). The percentage of cells affected in each participant was calculated as described in Supplementary Figure 3. Solid line in panel b indicates the threshold of LOY used in the survival analyses and the dotted line shows the threshold for estimation of the frequency of LOY in the studied cohort.

