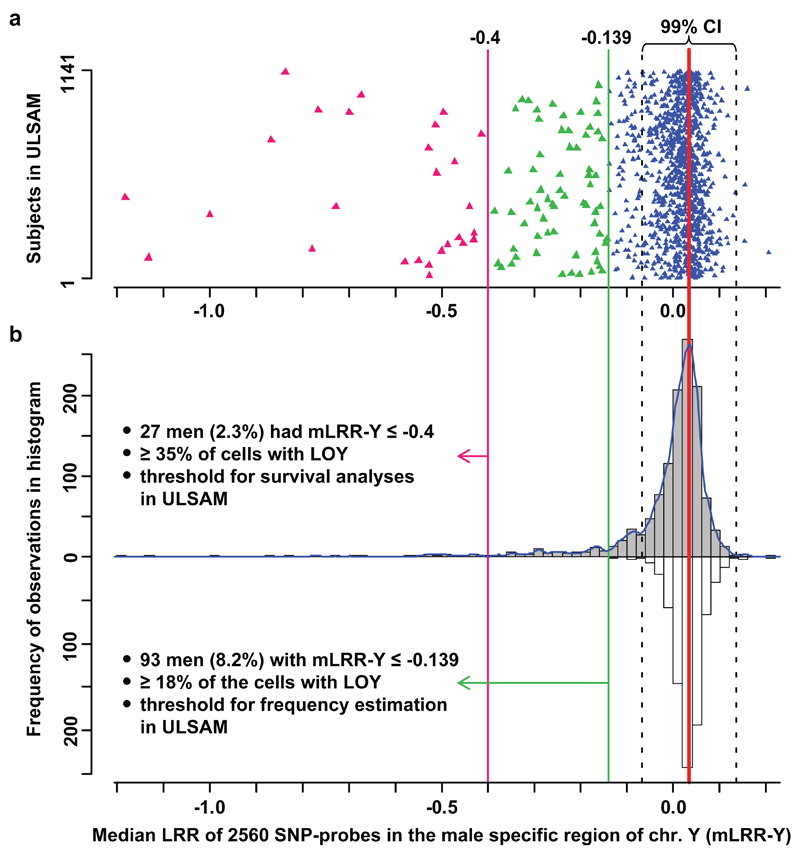
Figure 2.
LOY frequency estimation after accounting for experimental variation. Panel a show the median Log R Ratio (LRR) in the male specific part of chromosome Y (mLRR-Y) observed in 1141 men with no history of haematological malignancies prior to blood sampling. Each triangle represents one participant. Panel b show the distribution of the mLRR-Y (grey bars) and the experimental noise (white bars) that were used to find the threshold for estimation of LOY frequency. The latter distribution was generated as described in methods. The dotted black lines represent the 99% confidence intervals (CI) of the distribution of expected experimental background noise (white bars). Among the 1141 men we found that 168 subjects (14.7%) had a lower median LRR than the lower 99% CI representing LOY in ~13.1% of cells. For the frequency of LOY reported here, we used the lowest value in the noise-distribution as threshold (green line at -0.139).

