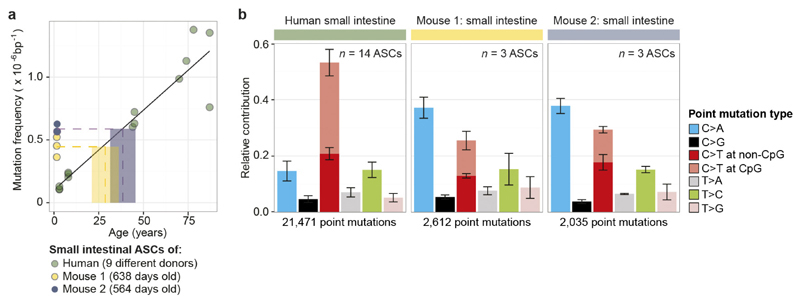
Extended Data Figure 8. Comparison of mutation loads between intestinal ASCs derived from human and mouse.
a, Mutation frequency in mouse intestinal ASCs is compared to the linear fit, describing the relationship between the mutation frequency in human intestinal ASCs and age of the donor. Indicated by the dotted lines are the mean mutation frequencies over all ASCs per mouse (n = 3) and the corresponding age of human linear fit. b, Relative contribution of the indicated mutation types to the point mutation spectra for all assessed human intestinal ASCs and for each mouse. Data are represented as the mean relative contribution of each mutation type over all the ASCs per indicated category (n = 14, 3 and 3 for human, mouse 1 and mouse 2, respectively), error bars indicate s.d.

