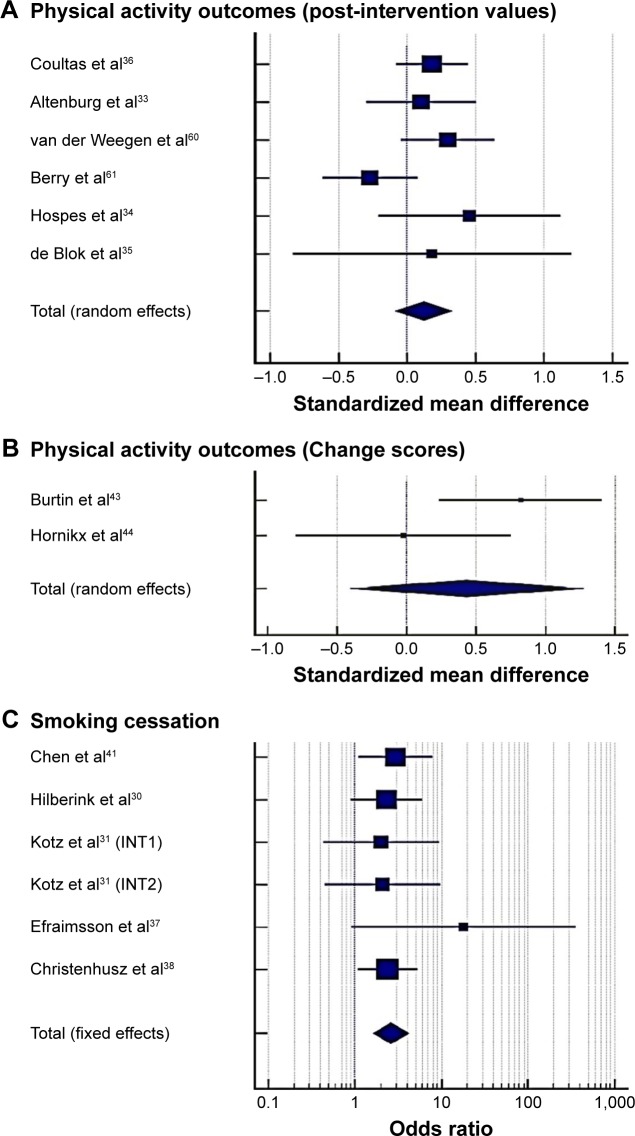
Figure 3.
Individual and pooled effects of counseling interventions on physical activity outcomes: standardised mean difference for post-intervention (A) and change values (B) and smoking cessation (C).
Notes: INT 1= intervention 1; INT 2= intervention 2 (i.e., this study had three groups, 2 interventions and a control).

