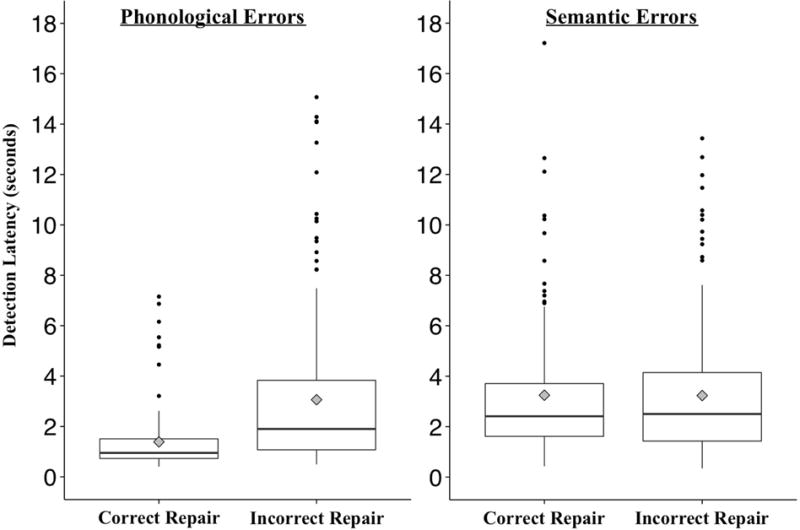
Figure 4.

Distributions of detection latencies for repair attempts. The bottom, middle, and top of each box represent the 25th, 50th, and 75th percentiles, respectively. Points represent outliers greater than 1.5 times the interquartile range. The diamond overlaid on each plot represents the mean.
