
Figure 1. Global and regional genome-wide association study results.
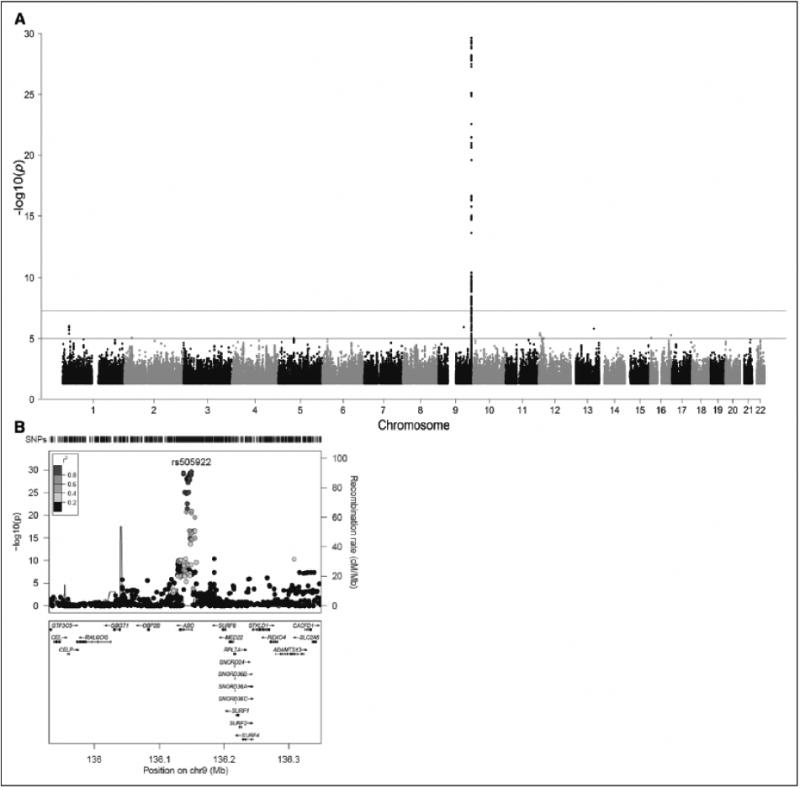
A, Manhattan plot of von Willibrand Factor GWAS results. Topline represents genome wide significance cutoff (p = 5x10⁻⁸). Bottomline represents genome wide suggestive line (p = 1x10⁻⁵) B, Regional association plot of chromosome 9 vWF associated locus surrounding ABO.