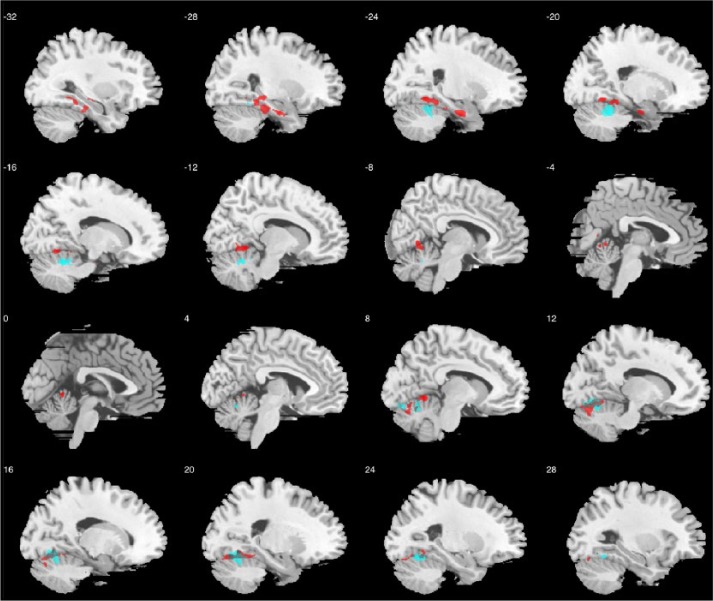
Figure 2.
Sagittal slices illustrating grey matter regions showing sex/gender-differential associations between CF and regional volume (in red, involving left medial temporal lobe and cerebellum), overlaid with regions showing negative correlations between CF and regional volume in women with autism (in blue, involving cerebellum, occipital and medial temporal structures); threshold for visualization follows that described in the ‘Methods’ section.

