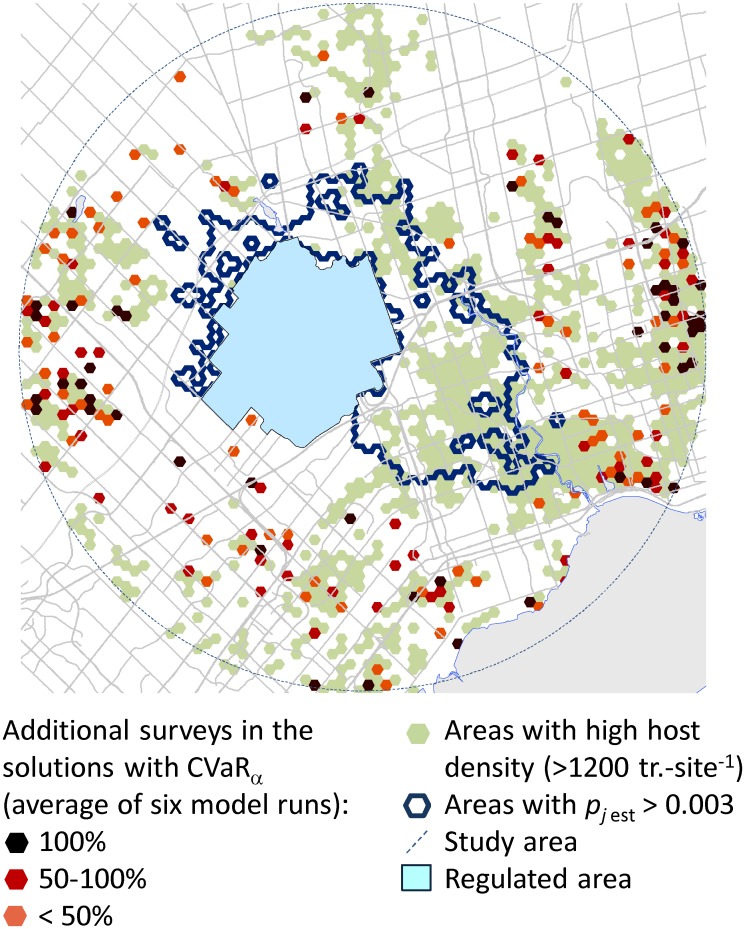
Fig 6. Additional survey sites in solutions with minimization of the extreme cost in the objective function via CVaR vs. solutions based on minimizing the expected cost only.
Colored (black, red, or orange) hexagons show survey sites that appeared in solutions with CVaR (F = 0.5) but not in solutions that minimized the expected cost (i.e., F = 0). Light green hexagons denote sites with high host density (> 1200 trees per survey site). An outline depicts the sites with the probability of ALB spread, pj est, above 0.003.

