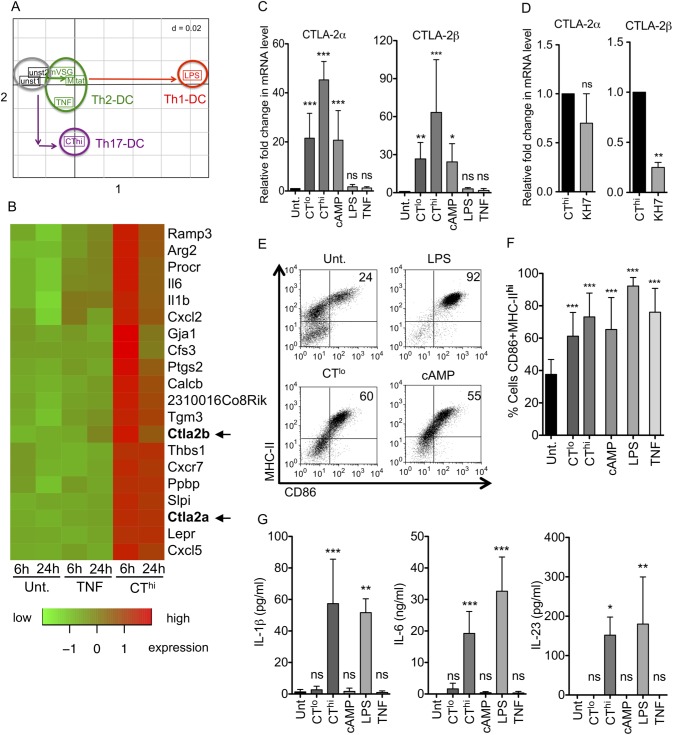
Fig 1. CT and cAMP induces both CTLA-2α and -2β during DC maturation.
BM-DCs were differentially matured with the indicated stimuli for 16h unless otherwise specified. (A) Principal component analysis comparing untreated BM-DCs, DCs matured for 6h with the Th2-inducing stimuli TNF, the Trypanosoma brucei antigens Mitat or mVSG, and the Th1-inducing LPS from our previous study [17] with CThi (1 μg/ml) matured Th17-inducing DCs investigated in this study. (B) Heat map displaying the top 25 genes regulated in DCs after CThi or TNF stimulation compared with untreated DCs. Data show single time point values of a single microarray. (C) Densitometric analysis of CTLA-2α and -2β expression levels determined by RT-sqPCR normalized to β-actin and relative to untreated control for n = 4 experiments; CTlo (0.1 μg/ml). (D) CThi stimulation of BM-DCs ± the cAMP inhibitor KH7 before RT-sqPCR normalized to β-actin of n = 3 independent and pooled experiments. (E) DC maturation analysis by flow cytometry of CD86 and MHC-II on CD11c positive cells. (F) Statistical evaluation of D with respect to untreated control for n = 5 experiments. (G) IL-1β, IL-6 and IL-23 secretion by differentially stimulated DCs measured by ELISA n = 3 experiments. Statistical analysis was performed with respect to untreated control. Error bars represent mean ± SD. One Way ANOVA, Dunnett post-test. *p<0.05, **p<0.01, ***p<0.001, ns: not significant. For D, student's t test, n = 3, *p<0.05.

