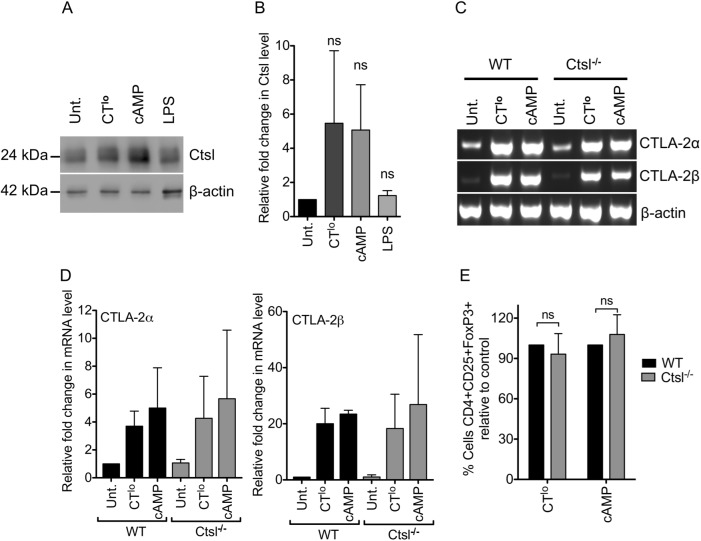
Fig 3. Cathepsin L expression in CT/cAMP-DCs does not influence iTreg conversion.
(A) BM-DCs were differentially matured with the indicated stimuli for 10 h (CTlo 0.1 μg/ml; cAMP 100 μM; LPS 0.1 μg/ml). Total cell lysates were analyzed for mature Ctsl protein content by Western Blot. One representative experiment is shown. (B) Densitometric analysis of Western blot data of 3 mice per group from 3 independent experiments performed like the one shown in A, normalized to β-actin and relative to untreated control. (C) BM-DCs were stimulated with CTlo or cAMP for 4 h. CTLA-2α and -2β mRNA expression was determined by RT-sqPCR, representative experiment, (D) Densitometric analysis of mRNA data of 3 mice per group from 3 independent experiments performed like the one shown in C, normalized to β-actin and relative to WT untreated control. (E) OT-II T cells were co-cultured with WT or Ctsl-/- BM-DCs-treated with CTlo or cAMP for 4 h in the presence of 100 ng/ml OVA327-339 peptide and 2 ng/ml TGF-β. After 5 days cells were analyzed by flow cytometry for Foxp3 and CD25 expression in a CD4+Vβ5+ gate. Data represent the change in the frequency of iTreg conversion using Ctsl-/- DCs normalized to WT DCs of n = 5 experiments. Error bars represent mean ± SD. (B) One Way ANOVA, Dunnett post-test. (E) Two-tailed Student’s t test. ns: not significant.

