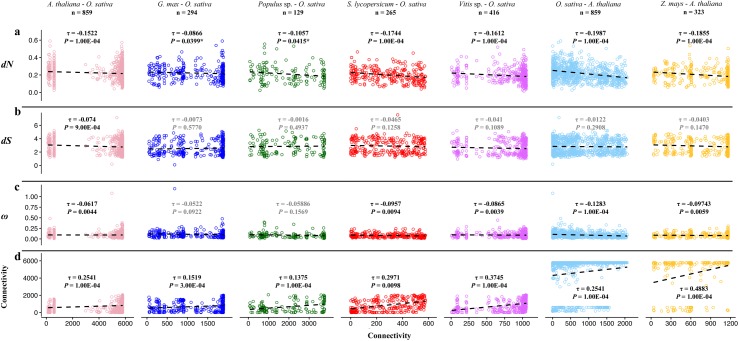
Fig 2. Linear regression of gene connectivity of seven taxa analyzed.
Taxa: A. thaliana, G. max, Populus spp., S. lycopersicum, Vitis spp., O. sativa, and Z. mays, against (a): non-synonymous substitutions (dN), (b): synonymous substitutions (dS), (c): estimates of adaptive evolution (ω = dN/dS) and (d): number of connections in ortholog comparison. Circles represent genes, while the regression coefficient, represented as Kendall's tau (τ) coefficient, is the dashed line. Significance is indicated by bold text. Note that all significant results except the two marked with an asterisk (*) remained significant after correcting for multiple comparisons (see text for details).

