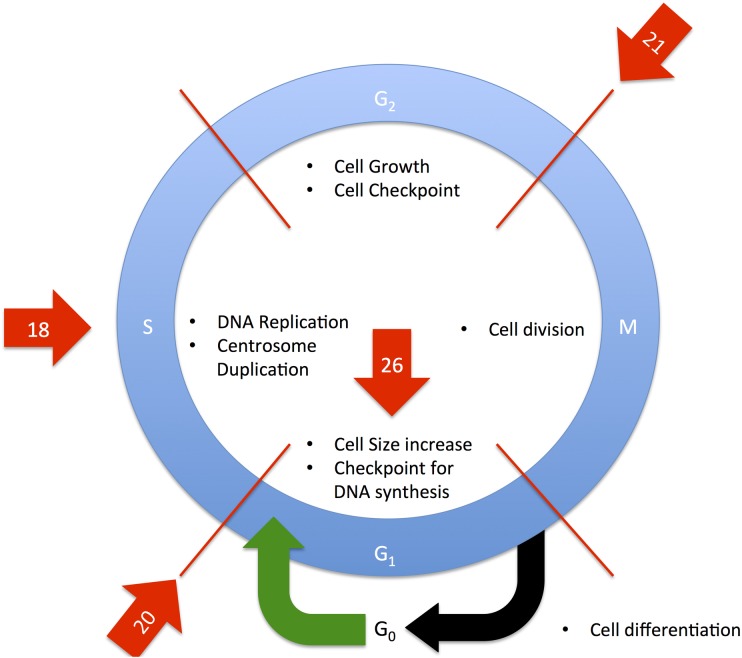
Fig 3. Depiction of the cell cycle.
Red arrows indicate parts of the cell cycle affected by heat stress. Red lines indicate transitions between stages of cell cycle. Numbers indicate number of genes at that specific stage of the cell cycle enriched in heat stress as identified by WebGIVI. The stages of cell cycle affected by heat stress include the G1 phase, G1/S phase transition, S phase, and G2/M phase transition.

