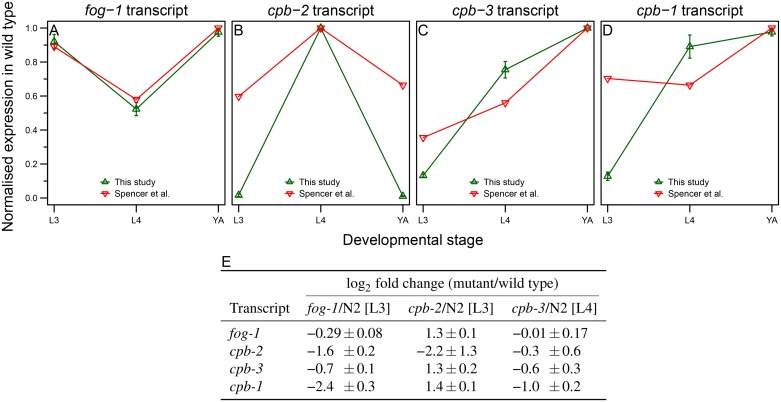
Fig 3. Transcript expression levels of C. elegans CPEB homologs in wild-type and CPEB mutant animals.
(A-D) Transcript expression levels of CPEB homologs in this study show similar trends as in the previously published dataset from Spencer et al. [31]. Normalised expression levels from both studies (normalised counts per million (CPM) in our dataset and normalised mean tiling array expression values in Spencer et al.) are shown for fog-1 (A), cpb-2 (B), cpb-3 (C), and cpb-1 (D) in wild-type animals at L3, L4, and YA stage. Error bars represent SEM between three biological replicates. The higher sensitivity of RNA-seq compared to tiling array is most likely responsible for the observed differences in CPEB levels between two studies. (E) Change in CPEB transcript levels in the various CPEB mutants relative to wild type. Data shown are average log2 scaled fold changes ± SEM. SEM in fold change between three biological replicates was calculated from the respective normalised CPM ratios.

