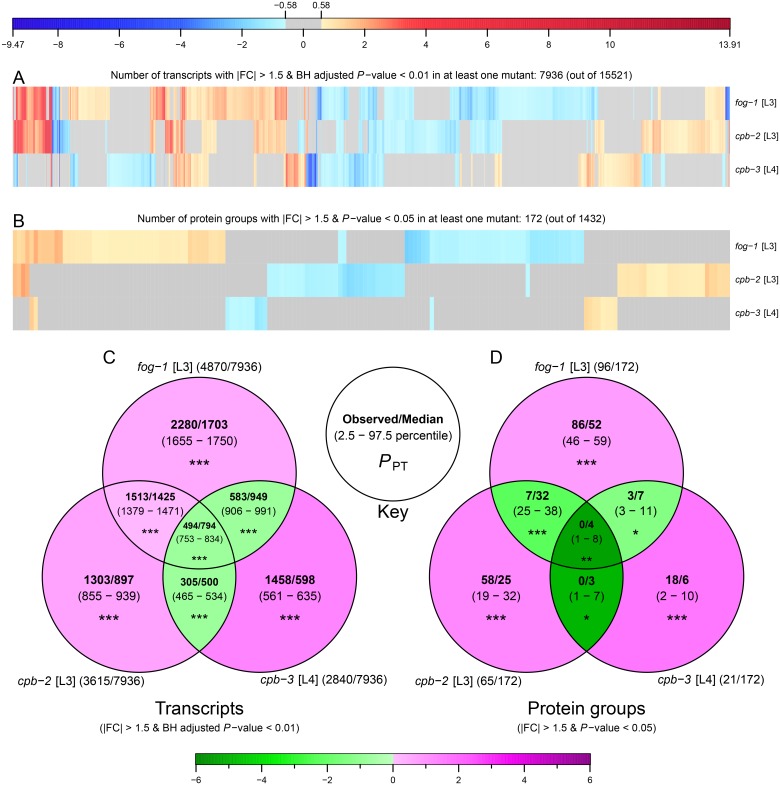
Fig 5. CPEB mutants tend to have distinct effects on gene expression.
(A-B) Heat maps representing the differential expression of transcripts (A) and protein groups (B) in CPEB mutants relative to wild type. Columns of heat maps were clustered using functions “dist” and “hclust” from the R package “stats” (version 3.2.4) using “euclidean” distance and “complete” method. Blue and red shades represent statistically significant log2 scaled fold changes, grey colour is used for changes below the absolute fold change cut-off of 1.5 (~ 0.58 on log2 scale) or above the statistical significant cut-off. Only transcripts and protein groups quantified in all three mutants with differential expression in at least one mutant were considered. (C-D) Overlap between differentially expressed transcripts (C) and protein groups (D) in CPEB mutants. Each set shows (see key) observed value and median along with the 2.5 to 97.5 percentile range in parentheses, calculated from the random permutation for 10000 iteration. Green and magenta shades in each set represent the log2 scaled fold changes of observed value relative to median of permutation distribution. Asterisks denote permutation test P-values (PPT): *P ≤ 0.05; **P ≤ 0.01; ***P ≤ 0.001. For each set the total number of differentially expressed transcripts or protein groups out of total transcripts or protein groups used in the analysis is shown in parentheses beside set names.

