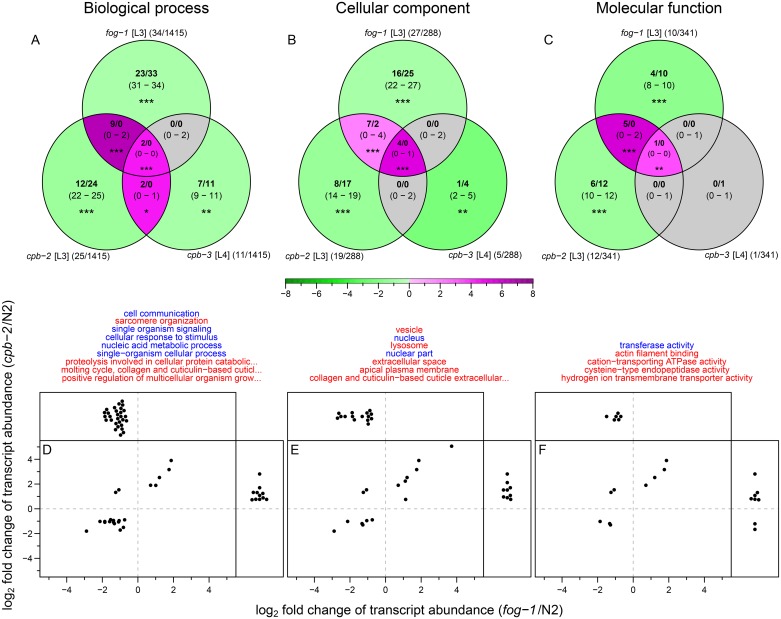
Fig 6. GO terms based on differentially expressed transcripts show a significant overlap between fog-1 and cpb-2 mutants relative to wild type.
(A-C) Overlap between (A) biological process (BP), (B) cellular component (CC), and (C) molecular function (MF) ontology terms in CPEB mutants (see S6 Fig). Each set shows (see key in Fig 5) observed value and median along with the 2.5 to 97.5 percentile range in parentheses, calculated from the random permutation for 10000 iteration. Green and magenta shades in each set represent the log2 scaled fold changes of observed value relative to median of permutation distribution; grey colour is used for nonsignificant differences. Asterisks denote permutation test P-values (PPT): *P ≤ 0.05; **P ≤ 0.01; ***P ≤ 0.001. For each set the total number of significant GO terms out of total GO terms used in the analysis is shown in parentheses beside set names. (D-F) Expression profile of transcripts associated with (D) BP, (E) CC, and (F) MF ontology terms (listed on top). Each dot represents one transcript associated with the GO terms found to significantly changed (enriched or depleted) in both fog-1 and cpb-2 mutants (in panels A-C). Transcripts that were quantified only in one mutant background are shown on the top or the side panels, transcripts quantified in both backgrounds are shown in the main panels. GO terms enriched in both fog-1 and cpb-2 mutants are coloured in red, those depleted in both fog-1 and cpb-2 mutants are coloured in blue.

