
Figure 3.
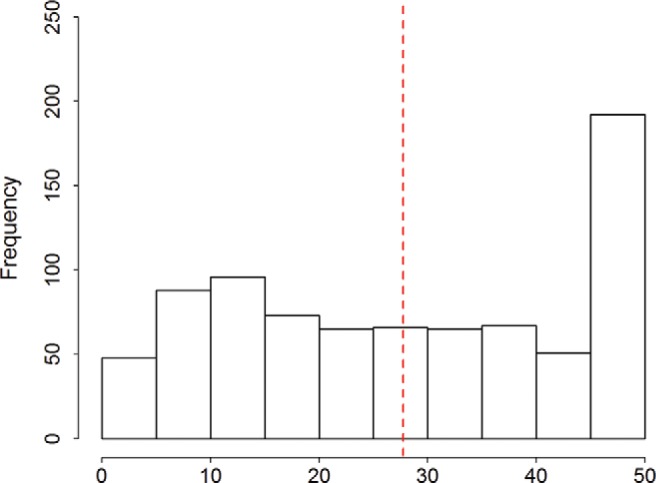
Distribution of absolute Time 1 confidence in belief about which candidate would win the election. The dashed line denotes the median. N = 811. See the online article for the color version of this figure.
Official websites use .gov
A
.gov website belongs to an official
government organization in the United States.
Secure .gov websites use HTTPS
A lock (
) or https:// means you've safely
connected to the .gov website. Share sensitive
information only on official, secure websites.
Distribution of absolute Time 1 confidence in belief about which candidate would win the election. The dashed line denotes the median. N = 811. See the online article for the color version of this figure.