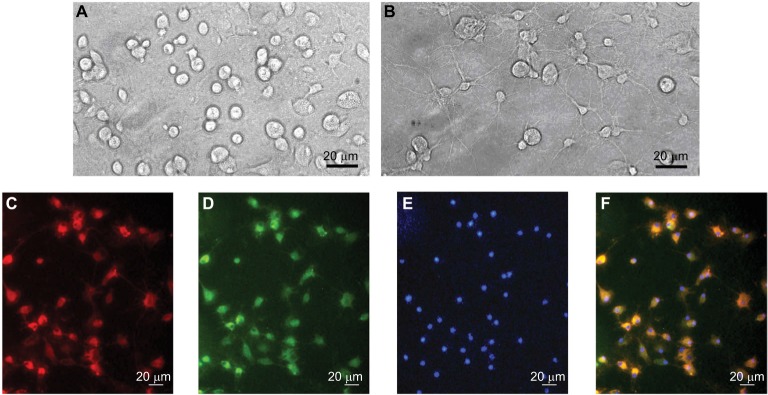
Figure 1.
Micrographs of cultured dorsal spinal cord microglia cells (A–F).
Notes: (A) High-magnification ×200 corresponding views of primary mixed glial cells. (B) The morphology of the microglia after purifying. (C–F) High-magnification corresponding views of microglia cells labeled for Iba-1 (C), OX-42 (D), DAPI (E) and their overlay (F). Scale bar: 20 μm.

