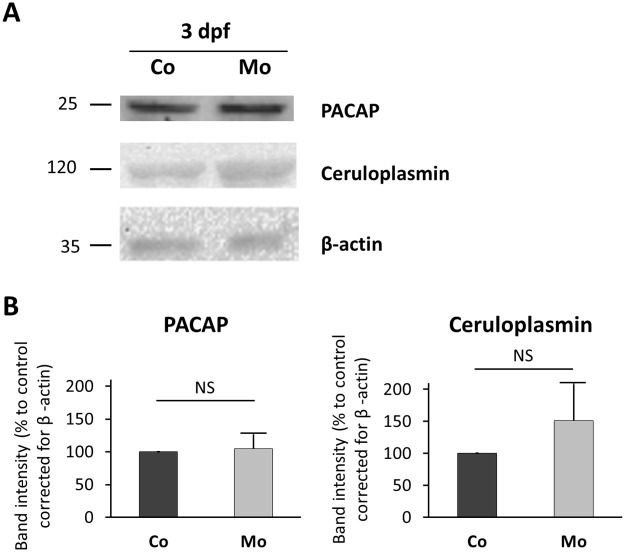
Fig 2. PACAP and ceruloplasmin protein levels in nephrin depleted zebrafish.
(A) Western blots for PACAP, ceruloplasmin, and β-actin (loading control) were performed using whole zebrafish lysates at 3 dpf for nephrin depleted (100 μM Nephrin morpholino) compared to control embryos. (B) Signal intensity of Western blot bands was measured using ImageJ software. Graphs represent means ± SD from two repeated experiments. A representative blot is shown. Means were compared using a two-tailed unpaired Student t test, but no significant difference was observed. Mo, nephrin morpholino injected; Co, control morpholino injected.

