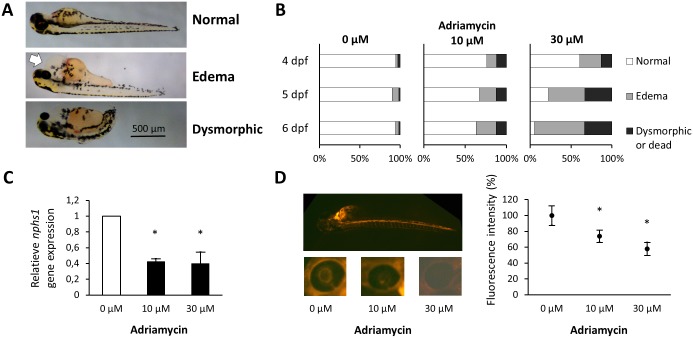
Fig 5. Phenotype analysis, nephrin expression and evaluation of glomerular function in adriamycin exposed zebrafish.
(A) Different categories of phenotype were defined in the adriamycin exposed embryos at 4 dpf: embryos with a normal phenotype, embryos with visible pericardial edema (white arrow) and dysmorphic or dead embryos. (B) 100 embryos per condition were live-screened at 4 dpf and assigned to a phenotype category. Increasing adriamycin concentrations in the culture medium were associated with an increasing percentage of embryos with pericardial edema. (C) qPCR was performed using total RNA from control and adriamycin exposed embryos at 4 dpf. A significantly decreased expression of nephrin (corrected for housekeeping gene elfa) was observed in the adriamycin exposed embryos compared to the control fish. The experiment was performed twice in triplicate. Bars represent means ± SD. * P<0.05 in comparison to condition without the addition of adriamycin. (D) Rhodamine-labeled 70 kDa dextran was injected in the cardiac venous sinus of 75 hpf old embryos. LEFT: A representative immunofluorescence picture of a control embryo immediately after injection shows the distribution of fluorescence through the vascular system of the zebrafish larva. A dose-dependent diminishing effect of adriamycin on fluorescence recorded in the fish eye 5 hours after injection was observed. Representative images of the eye from 0, 10 and 30 μM adriamycin treated embryos 5 hours after injection are shown. RIGHT: A diagrammatic representation shows the quantification of the mean fluorescence intensity ± SD recorded in the retinal vascular bed. * P < 0.05 in comparison to condition without the addition of adriamycin.

