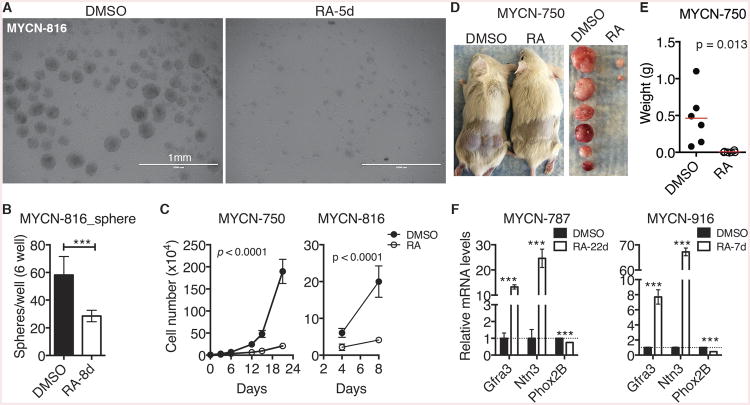
Figure 2. Retinoic acid induces growth arrest and differentiation of neuroblastoma sphere-forming cells.
(A-B) Phase-contrast images (A) and quantification (B) of spheres treated with DMSO or 10 μM RA. Error bars (B) represent SD (n = 3).
(C) Growth assays of spheres treated with DMSO or 10 μM RA. Viable cells were quantified by trypan blue staining. Error bars represent SD (n = 4). Data were analyzed by two-way ANOVA with p values indicated.
(D-E) Tumor transplantation assay of spheres treated with DMSO or 10 μM RA for 7 days. Tumor weight (E) was analyzed by scatter plot with horizontal lines indicating the mean.
(F) qRT-PCR analysis of mRNA expression in spheres treated with DMSO or 10 μM RA. Error bars represent SD (n = 3).
Unless indicated, data were analyzed with two-tailed Student's t-test. ***p < 0.001. See also Figure S2.

