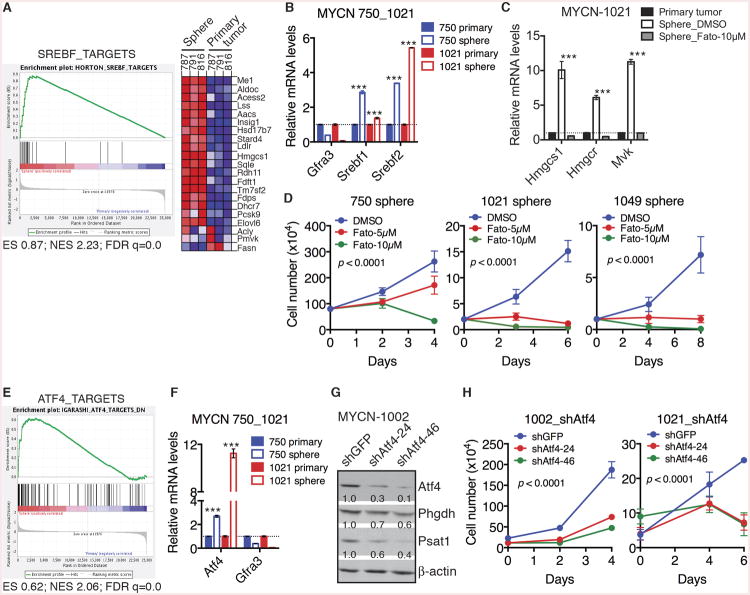
Figure 5. Srebf and Atf4 mediate the metabolic reprogramming in neuroblastoma sphere-forming cells.
(A) GSEA showing significant enrichment of Srebf targets, with most genes being upregulated in neuroblastoma sphere-forming cells relative to parental primary tumor cells.
(B) qRT-PCR analysis of mRNA levels of Gfra3, Srebf1 and Srebf2 in neuroblastoma sphere-forming cells in comparison with their parental primary tumor cells. Error bars represent SD (n = 3).
(C) qRT-PCR analysis of mRNA levels of cholesterol pathway genes in parental primary tumor cells and neuroblastoma sphere-forming cells treated with DMSO or 10 μM Fatostatin (Fato) for 48 hours. Error bars represent SD (n = 3).
(D) Growth assays of neuroblastoma sphere-forming cells treated with DMSO or Fatostatin. Error bars represent SD (n = 4). Data were analyzed by two-way ANOVA with p values indicated.
(E) GSEA showing significant enrichment of Atf4 targets, with most genes being upregulated in neuroblastoma sphere-forming cells relative to parental primary tumor cells.
(F) qRT-PCR analysis of mRNA levels of Gfra3 and Atf4 in neuroblastoma sphere-forming cells relative to their parental primary tumor cells. Error bars represent SD (n = 3).
(G) Immunoblot analysis of Atf4, Phgdh and Psat1 levels relative to β-actin in neuroblastoma sphere-forming cells without or with Atf4 knockdown.
(H) Growth assays of neuroblastoma sphere-forming cells without or with Atf4 knockdown. Error bars represent SD (n = 4). Data were analyzed by two-way ANOVA with p values indicated.
**p < 0.01, ***p < 0.001. See also Figure S5 and Table S1.

