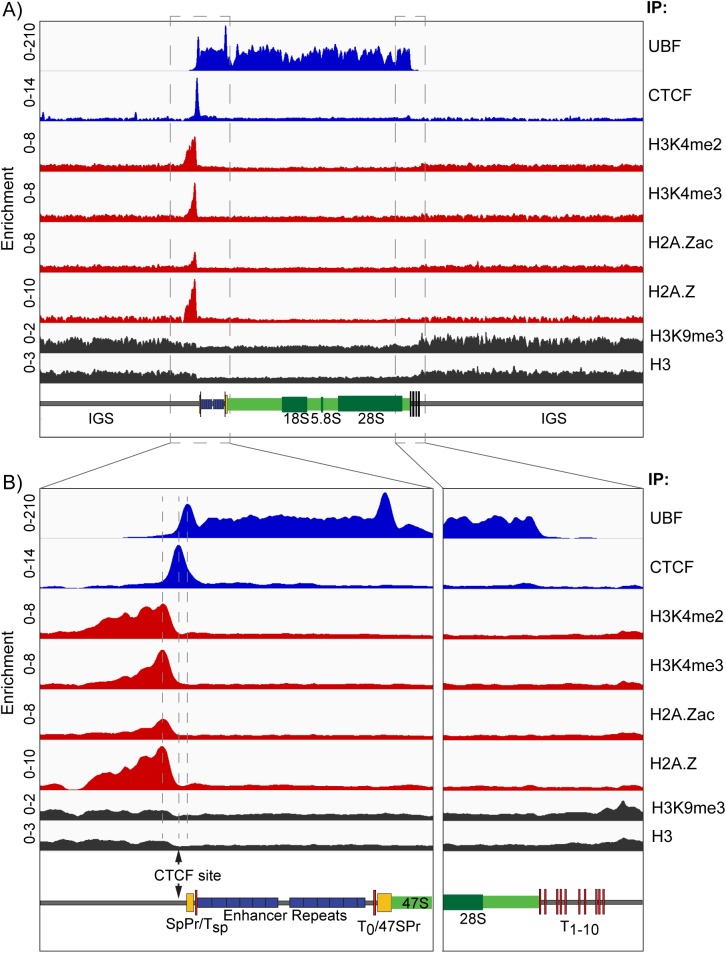
Fig 6. The UBF binding domain is delineated by an Enhancer Boundary Complex.
A) The ChIP enrichment profile maps for UBF, CTCF, H3K4me2, H3K4me3, H2A.Zac, H2A.Z, H3K9me3 and H3 across the full rDNA repeat unit. B) Higher resolution maps for the upstream Enhancer and Promoter elements and the 47S termination site (boxed in A). The position of the predicted CTCF binding site [67] is indicated. As in Fig 1, a scale map of the rDNA sequence elements is given below each panel, and ChIP enrichments for each factor are given as; ChIP-Seq RPM/Input DNA RPM.

