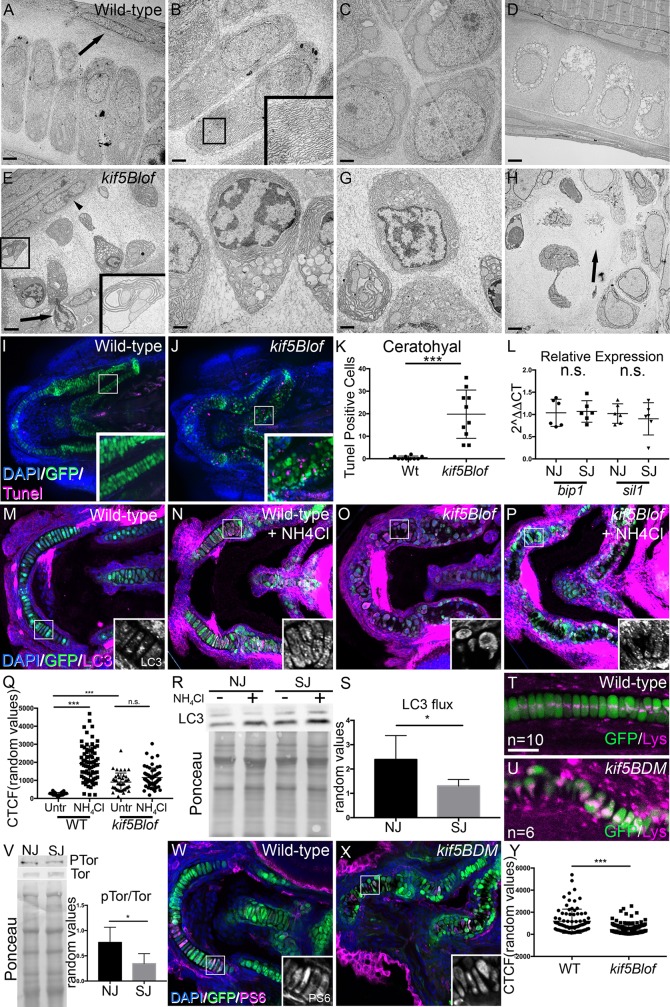
Fig 5. Autophagy and chondrocyte maintenance in kif5Blof cartilage.
A-D) Electron microscopy of the Wt palatoquadrate. At 3 dpf Wt rER and mitochondria are apparent within stacked chondrocytes (A, B and inset). In the proliferative region (PR), cells are round (C). Cartilage is dense near the perichondrium (arrow in A). At 5 dpf, Wt chondrocytes are hypertrophic with large vacuoles but are stacked (D). E-H) At 3 dpf, kif5Blof cartilage contains small, round highly vacuolated cells (E, F and inset) with pronounced rER expansion (E and inset). Both rER and vacuoles appear to contain cellular components (F and inset in E). In the PR, overall chondrocyte morphology is more normal, but with the previously mentioned intracellular characteristics (G). Nuclei are patchy and distributed towards the cartilage border (E, F). Cells are extruded from the cartilage (arrow in E) and the region near the perichondrium is disorganized (arrowhead in E). At 5 dpf, degeneration persists and cartilage “ghosts” remain (arrow in H). I, J, K) Tunel (apoptotic) cells were rare in wild-type embryos, but are abundant in kif5Blof mutants. Tunel-positive cells in the ceratohyal (10 embryos were quantified/group). L) ER stress marker (bip1 and sil1) levels. Scale bar: A, D, E, H: 2μm; B, C, F, G: 1μm. n.s. no significant; *** p<0.001 (Student T test). M-S) At 4 dpf in basal conditions, Wt embryos show LC3 positive puncta in chondrocytes (M), which increases after exposure to NH4Cl (N). Basal LC3 staining is higher in kif5Blof mutants (O) and increases less after drug exposure (P). LC3 fluorescence intensity quantification (5–10 cells in at least 10 embryos/group) (Q, ANOVA). LC3 flux as measured by western blot in embryos with normal jaws and with short jaws (R, LC3 protein and Ponceau staining to reveal total protein loaded, S, quantification, Student T test). I, J) Lysotracker (magenta) stains acidic cellular compartments, including lysosomes. In Wt chondrocytes, several puncta are observed near the nucleus (T). Lysotracker accumulation in kif5Blof mutants (U). V) Reduced Tor activation in embryos with short jaws (V, P-Tor and Tor western blot and Ponceau staining to assess total protein loaded, Student T test, n = 4). W-Y) Phospho-S6 Ribosomal Protein (PS6) abundance in chondrocytes of Wt embryos (W) and in kif5blof mutants (X), quantified in Y (At least 5–10 cells in at least 10 embryos, Student T test). NJ: normal jaw (Wt), SJ: short jaw (kif5Baae12/ae12Kif5Bbae24/+ and kif5Baae12/ae12Kif5Bbae24/ae24).

