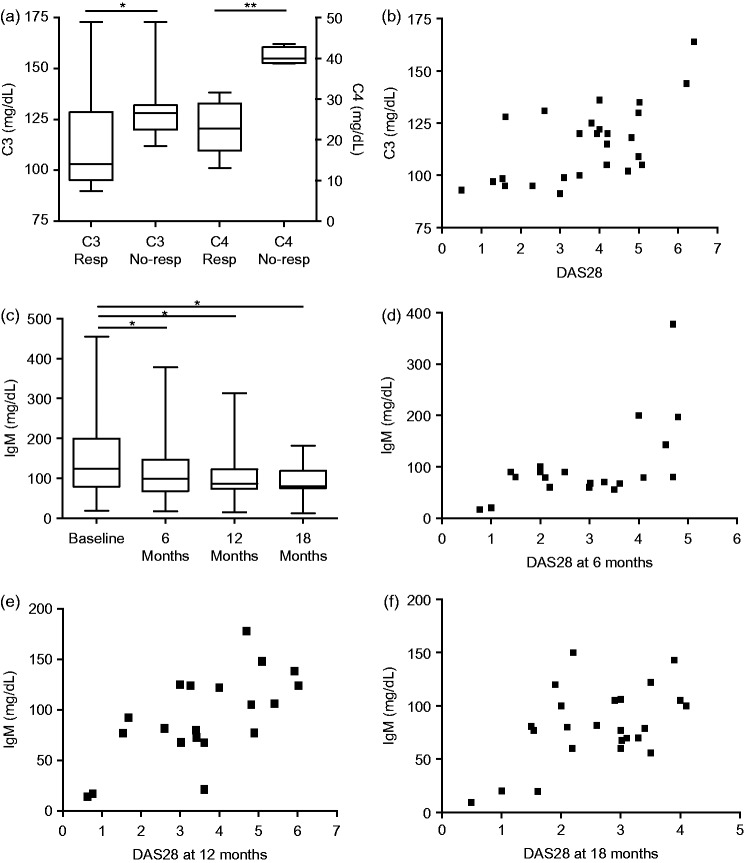
Figure 1.
(A) Plasma complement (C)3 and C4 levels in patients with rheumatoid arthritis (RA) classified as treatment responders (Resp) and nonresponders (No-resp) after 12 months’ rituximab therapy. (B) Correlation between plasma C3 level and disease activity score on 28 joints (DAS28) in patients with RA after 12 months’ rituximab treatment. (C) Immunoglobulin (Ig) M levels in patients with RA at baseline and during rituximab treatment. (D) Correlation between IgM levels and DAS28 in responding RA patients after 6, (E) 12 and (F) 18 months’ rituximab treatment. *P < 0.05; Mann–Whitney U-test.

