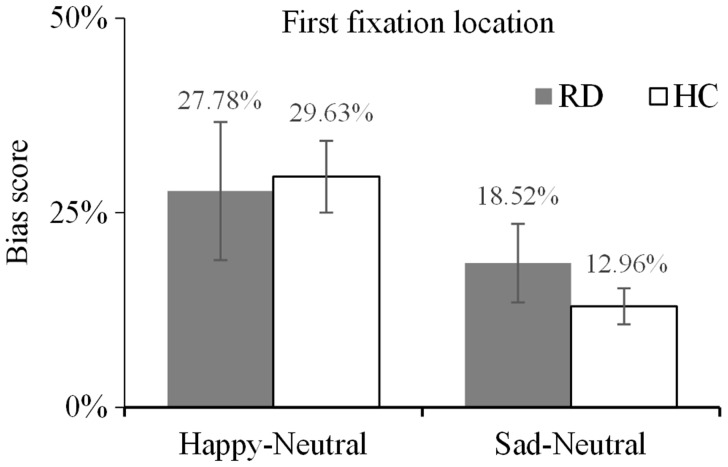
Figure 2.
Mean bias scores for the first fixation location for happy and sad facial expressions. Comparison between depressed patients in the remission stage (RD group) and healthy control subjects (HC group). Scores >25% indicate a bias toward emotional facial expressions, while scores ≤25% indicate a bias toward neutral faces. The error bars represent the standard error.

