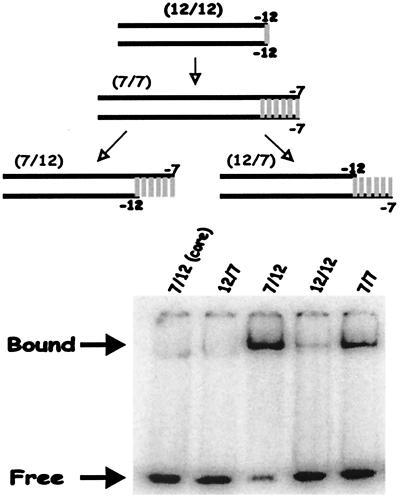
Figure 1.
EMSA of lac UV5 (CAGGCTTTACACTTTATGCTTCCGGCTCGTATAAT) duplex and fork probes with bound and free probes indicated by arrows. The numbers refer to the position of the last base present in each strand with respect to the transcription start site. The probe names are in parenthesis. Vertical bars represent the −10 consensus region.

