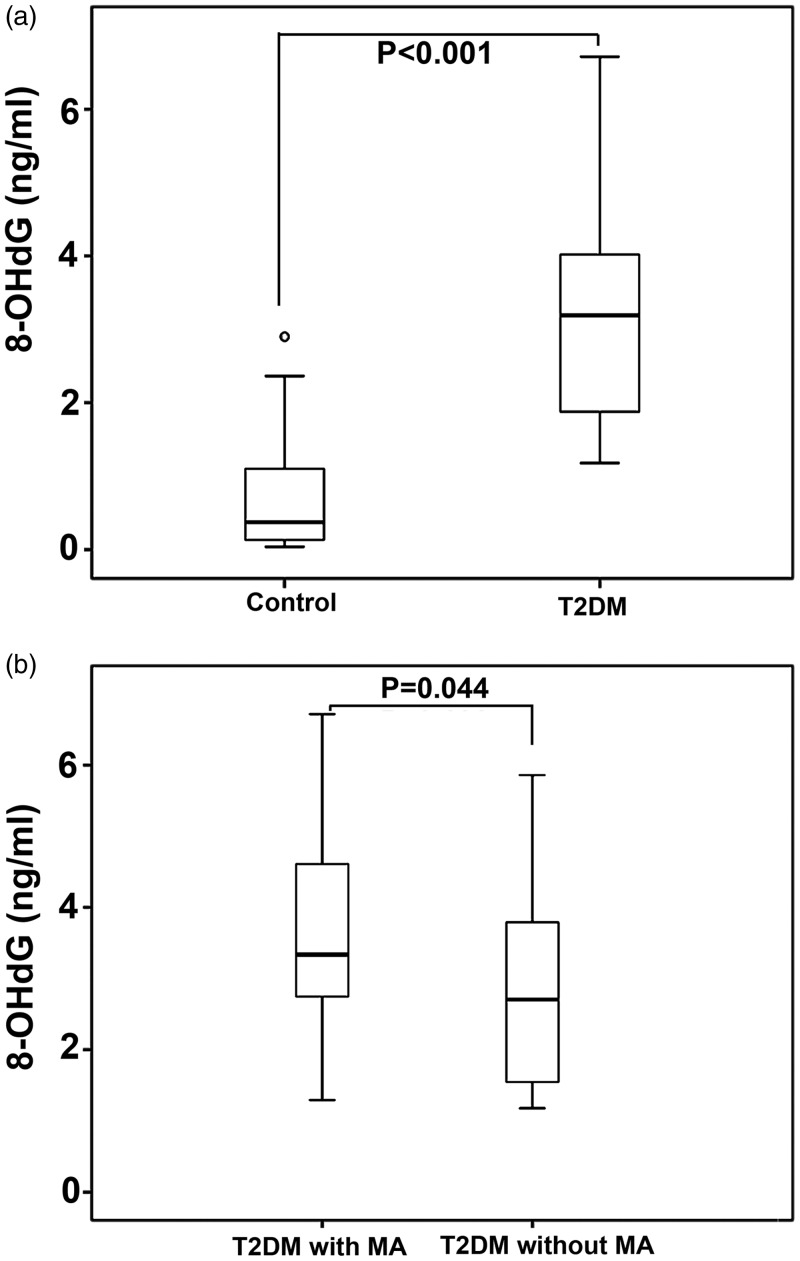
Figure 1.
8-hydroxy-2’-deoxyguanosine (8-OHdG) levels in Chinese patients with type 2 diabetes and healthy controls. (a) 8-OHdG levels in patients with type 2 diabetes and controls; (b) 8-OHdG levels in patients with type 2 diabetes and microangiopathy and in patients with type 2 diabetes without microangiopathy. The central (heavy) black lines within the boxes represent the medians, the extremities of the boxes are the 25th and 75th percentiles, the error bars represent minimum and maximum outliers, the circle above the ‘control’ bar represents an extreme outlier. T2DM, type 2 diabetes; MA, microangiopathy. (P < 0.05, Mann–Whitney U-test).

