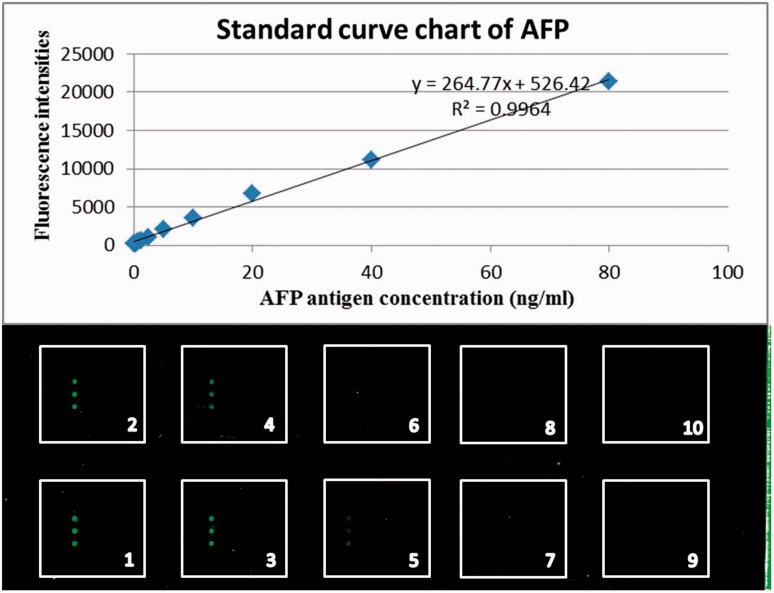
Figure 1.
Alpha-fetoprotein (AFP) antigen levels detected and the standard curve chart by the AFP protein microarray. The standard curve of AFP was created by applying different concentrations of AFP antigen (1: 80 ng/ml, 2: 40 ng/ml, 3: 20 ng/ml, 4: 10 ng/ml, 5: 5 ng/ml, 6: 2.5 ng/ml, 7: 1.25 ng/ml, 8: 0.0625 ng/ml, and 9: 0.03125 ng/ml) and 10: 0.05% phosphate-buffered saline-Tween 20 as a negative control to the microarray plate coated with the anti-AFP antibody. The colour version of this figure is available at: http://imr.sagepub.com.

