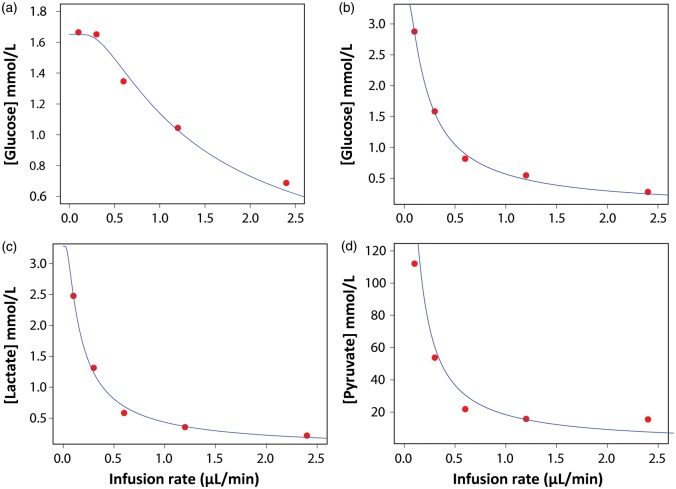
Figure 1.
Example of the graphical representation of the extrapolation to zero-flow method. Using non-linear curve fitting to the equation described by Jacobson et al.18 (see equation (2) in the manuscript), the concentration in the matrix and in the extracellular fluid (C0 in equation (2)) corresponds to the y-intercept. (a) In vitro extrapolation of the glucose data for catheter # 5. The estimated C0 was 1.65 mmol/L, the value of k (where k = rA in equation (2)) was 1.17 mm/min, and the measured C0 for glucose was 2.06 mmol/L. (b) In vivo extrapolation of the glucose data for patient # 12 (C0 = 3.43 mmol/L, k = 0.18 mm/min). (c) In vivo extrapolation of the lactate data for patient # 12 (C0 = 3.28 mmol/L, k = 0.14 mm/min). (d) In vivo extrapolation of the pyruvate data for patient #12 (C0 = 169 mmol/L, k = 0.11 mm/min).

