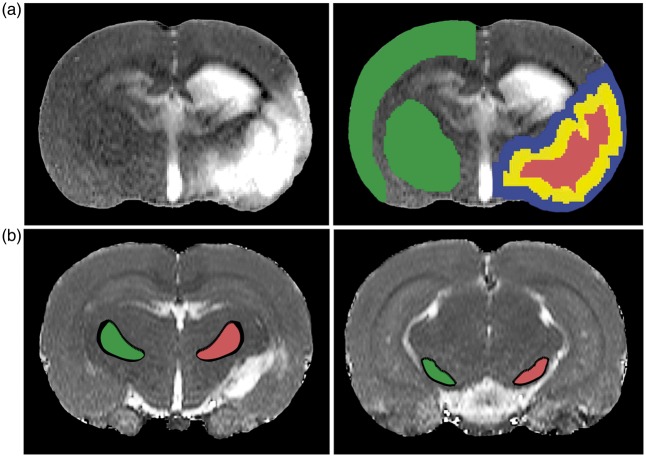
Figure 1.
T2 maps of coronal brain slices depicting the regions-of-interest (ROIs). (a) Lesioned tissue was indentified by elevated T2 values (left image). Total lesion volume (red and yellow ROIs combined) was calculated from ipsilateral tissue voxels with T2 values 2SD above the mean of values in contralateral grey matter (superimposed on normalized T2 maps) (right image). Subsequent automated image processing (i.e. erosion and dilation) generated three ROIs: lesion core (red), intralesional borderzone (yellow) and extralesional borderzone (blue). A contralateral ROI (green) encompassing cortical and subcortical tissue was manually selected. (b) Ipsi- (red) and contralateral ROIs (green) of the VPN (left image) and SN (right image) were manually outlined on posterior slices.

