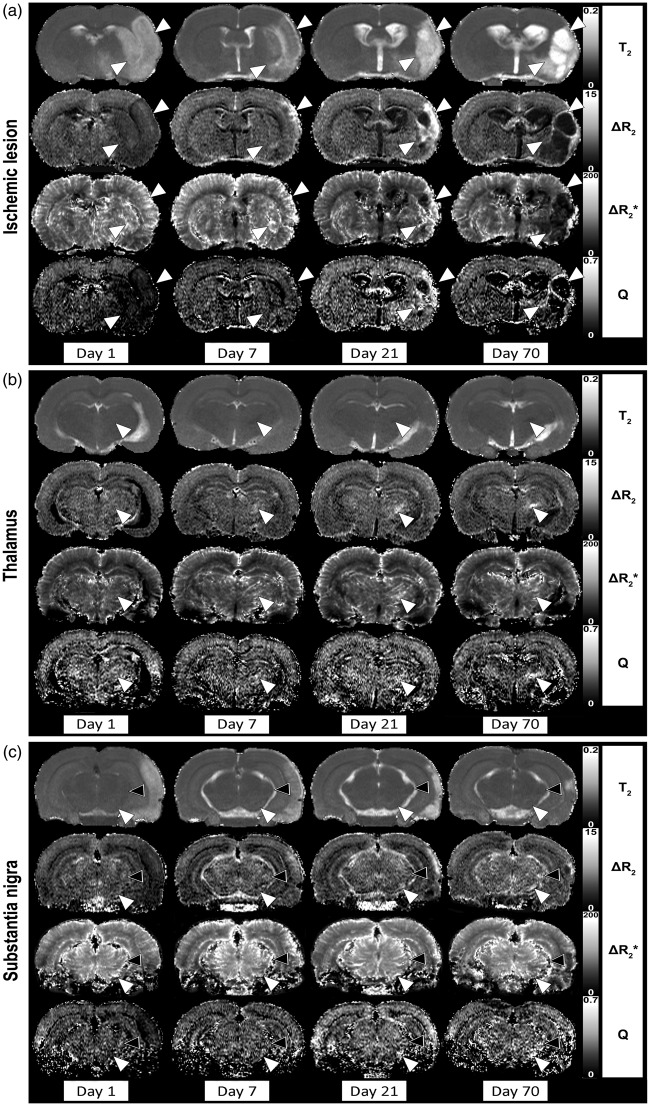
Figure 2.
Quantitative maps of pre-contrast T2, ΔR2 (microvascular CBV), ΔR2* (total CBV) and Q (MVD) in rat brain at different time-points after 60-min unilateral MCAO. Maps of coronal rat brain slices are shown at the level of the primary lesion site (cortical and striatal borderzones depicted by white arrowheads) (a), thalamus (VPN depicted by white arrowheads) (b) and substantia nigra (white arrowheads) and medial geniculate nucleus (black arrowheads) (c).

