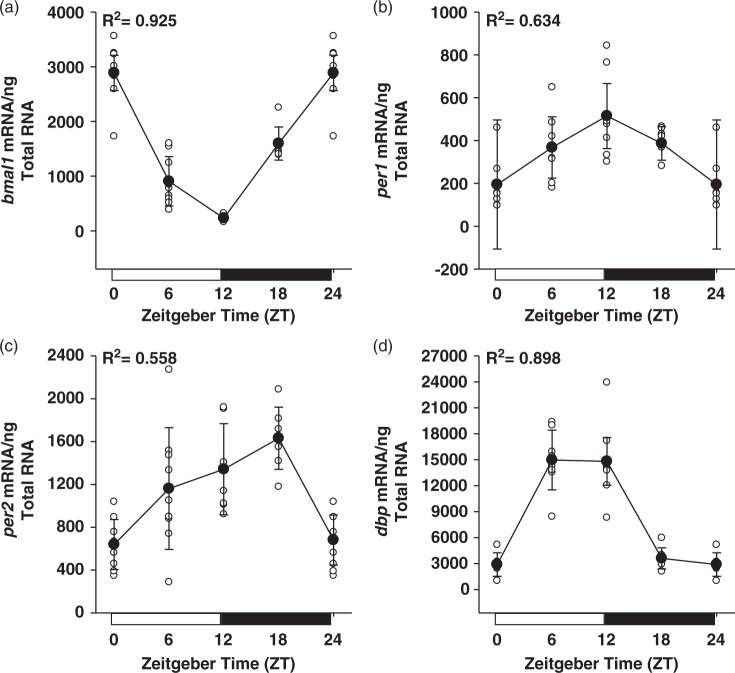
Figure 1.
Rhythmic expression of the circadian clock genes bmal1 (a), per1 (b), per2 (c), and the clock output gene dbp (d), in rat cerebral arteries isolated over the course of 24 h. R2 values resulting from cosinor analysis, assuming 24-h periodicity, are presented for each gene. Data are shown as the mean ± SD; n = 8 for ZT0/12/ 24, n = 9 for ZT6, and n = 7 for ZT18.

