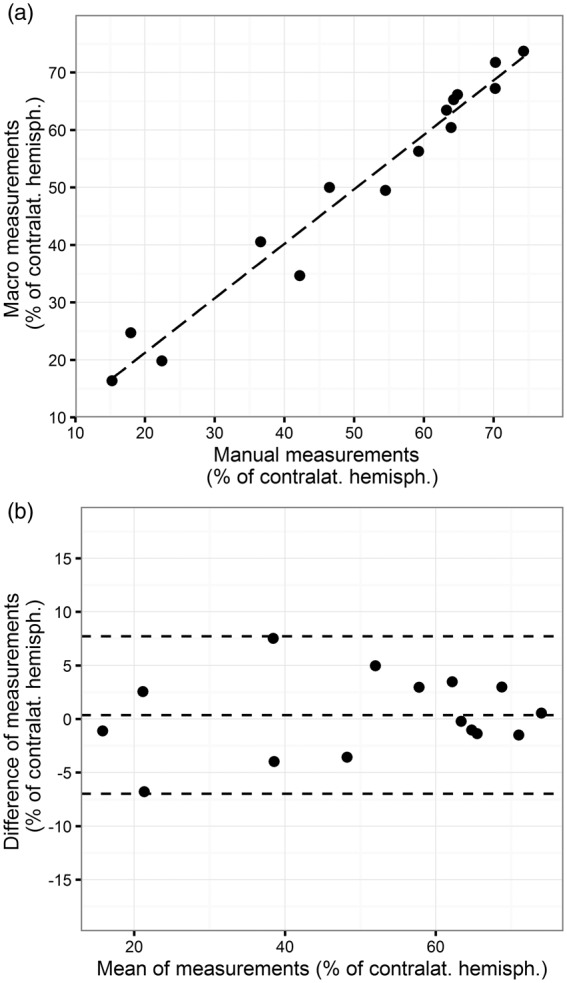
Figure 2.

Validity of infarct volumetry with an ImageJ macro. (a) Correlation of manual infarct volumetry with automated infarct volumetry. To reduce the effects of reliability, means of measurements by 11 raters were correlated. (b) The Bland–Altman plot shows the average of the differences between the measurements with both methods. The central dashed line near zero indicates the lack of systematic bias, the upper and the lower line indicate the limits of agreement. The difference between the measurements of both methods does not differ between small values or large values, indicating high consistency among different infarct sizes.
