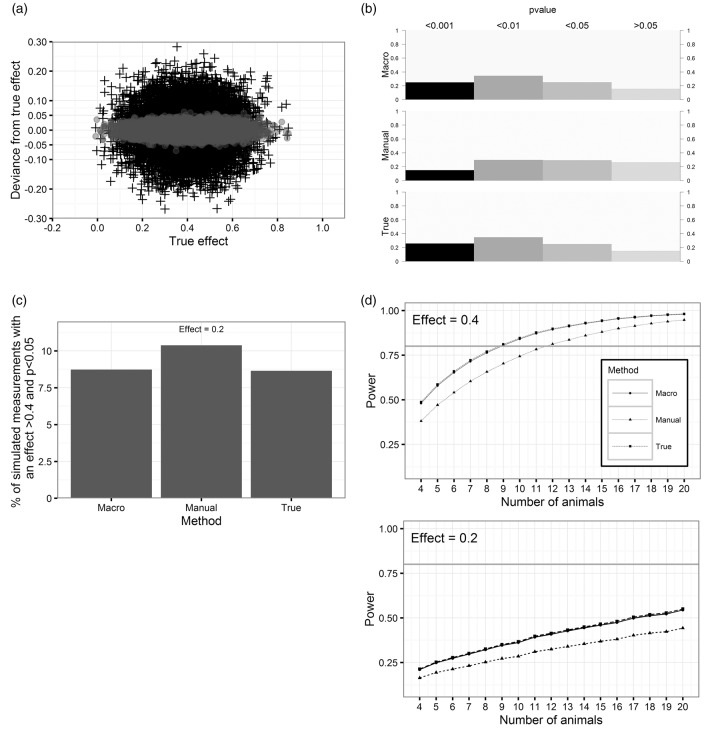
Figure 4.
Simulated effects of the reliabilities on the precision of the observed effect, p-values, effect inflation and power. (a) Effect of reliability on the precision of the estimate. The crosses show the difference of the observed effect with manual measurement error to the effect without measurement error (mean = 0.4). Gray dots indicate the imprecision using the macro. (b) Distribution of observed p-values of simulated measurements by the different methods (mean effect = 0.4). (c) Percentage of observed effects >0.4 and p < 0.05 if true mean effect is 0.2. (d) Estimation of power/sample sizes for different reliabilities and effects of 0.4 and 0.2.

