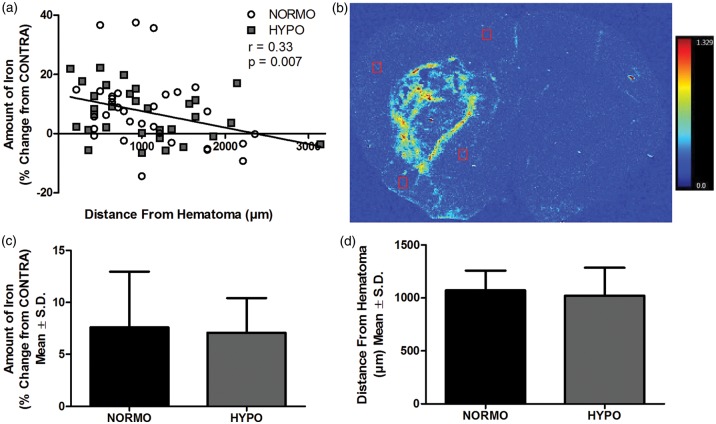
Figure 2.
(a) There was a significant relationship between the amount of iron and distance from the border of the hematoma (r = 0.33 p = 0.007). (b) A representative XFI map showing the amount and location of total iron. The red boxes illustrate representative placements of the regions of interest (four regions/animal). The intensity scale bar ranges from 0.0 to 1.329 µg/cm2 of iron. (c) The average amount of iron and (d) the average distance of the regions of interest were not different between NORMO and HYPO (p ≥ 0.674). N = 8 animals/group.

