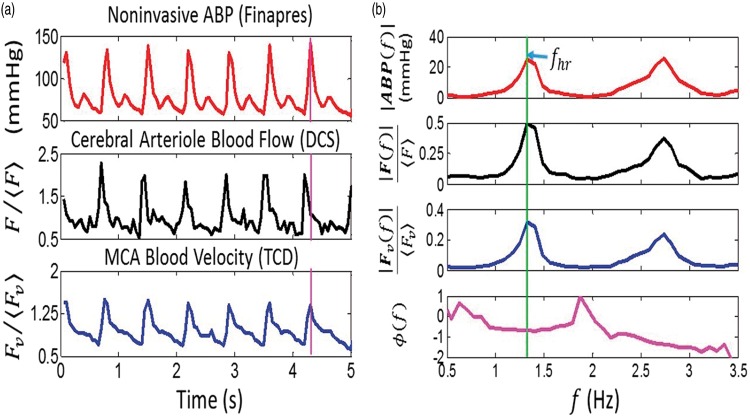
Figure 4.
Temporal measurements of noninvasive ABP, and waveforms in a representative subject (panel (a): the angular brackets, denote long-time-averaged temporal means). In panel (b), the Fourier spectral amplitudes and the phase difference between F and ABP, i.e. , are plotted against frequency, f. (See text for details on how the spectral amplitudes and phase were computed.) The vertical purple line in panel (a) shows the DCS arteriole blood flow waveform (F) is temporally shifted to the left of the ABP waveform, which corresponds to a negative phase difference at the heart rate frequency. Significant phase differences between the TCD MCA blood velocity waveform (Fv) and ABP were not observed (see text for reasons).

