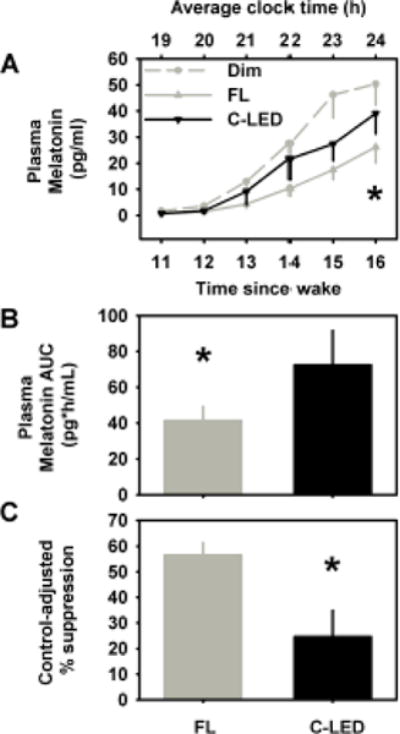
Figure 2. Effects of spectral tuning on pre-bed melatonin suppression.

Melatonin secretion related outcome measures included the time course of melatonin secretion profiles during the 6-h constant posture interval under C-LED (black line), FL (gray line) and dim light (gray dashed line) (A), melatonin area under the curve (AUC) secretion during the 6-h CP under C-LED and FL conditions (B), and melatonin suppression calculated as the difference in the AUC during the 6-h CP interval of the light exposure adjusted to the corresponding dim-light control interval 24 h earlier (C). Data are expressed as group means ± SEM. * p<0.05; between lighting conditions.
