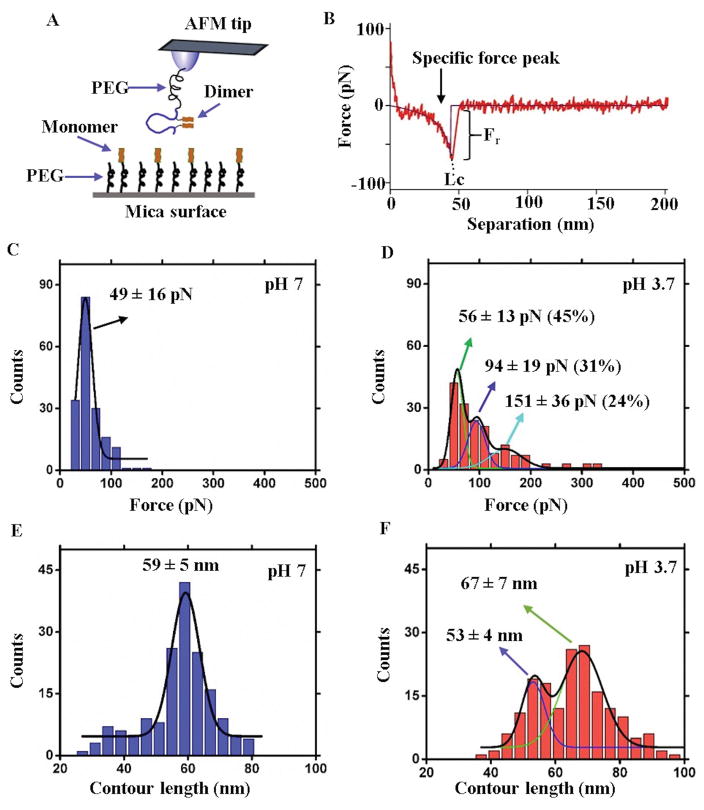
Figure 3. AFM single-molecule force spectroscopy study for Aβ(14–23) trimers.
(A) Schematic presentation of the experimental setup. (B) A representative force-distance (F–D) curve showing specific force peak values for the disociation of the trimer (shown by arrow). The purple line indicates the WLC fitting that estimates Fr and Lc. (C) Force histogram at pH 7 showing a narrow distribution and fitted with a single Gaussian (n=178). (D) Force histogram at pH 3.7 showing a broad distribution and fitted with three Gaussians (n=174). The numbers in parentheses indicate the percent of each type of complex within the population as calculated from the area under each fitting. (E) and (F) show the contour length distributions at pH 7 and 3.7, respectively, and n is the number of data points. The values are shown as mean ± S.D.

