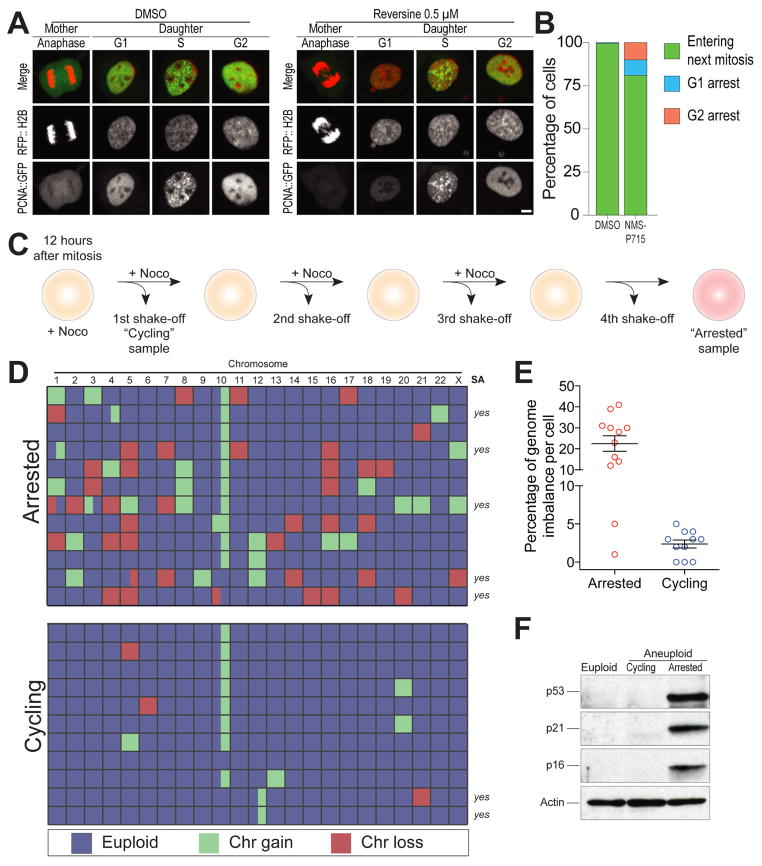
Figure 1. p53 activation is not an obligatory consequence of chromosome mis-segregation.
(A) Representative images of hTERT RPE1 cells co-expressing PCNA::GFP and RFP::H2B. Unsynchronized cells were treated with DMSO or 0.5 μM reversine and then immediately filmed for 48h. Cells were filmed every 5 min for 6 hrs to capture mitotic mis-segregation events and then every 20 min for 42 hrs to capture daughter cell S phase timing. Scale bar 5 μm.
(B) Daughter cell fate in NMS-P715-treated hTERT RPE1 cells co-expressing PCNA::GFP and RFP::H2B. Unsynchronized cells were treated with DMSO or 1μM NMS-P715 and immediately filmed as described in (A). Bars represent percentage of daughter cells with the indicated cell fate.
(C–E) Schematic representation of experimental method used to separate cells that arrest in G1 following chromosome mis-segregation from cells that continue to divide (C). RPE-1 cells were synchronized at the G1/S transition by thymidine treatment. Six hours after Thymidine release, cells were treated with 0.5 μM reversine for 12 hours. Six hours later cells were treated with nocodazole. 12 hours later, mitotic cells were removed by shake-off and single cells that detached from the plate were sequenced to determine the karyotype of cells that continue to proliferate after chromosome mis-segregation (cycling). The cells that were not removed by shake-off were placed into fresh medium containing nocodazole. This procedure was repeated three times in order to remove all dividing cells. The cells that remained attached to the plate represented arrested cells (arrested) and their karyotype was determined by single cell sequencing. Heat map in (D) shows chromosome gains and losses in the indicated cell populations. Partially colored boxes represent segmental aneuploidies and are marked as “yes” in the column SA (for segmental aneuploidies). The graph in (E) shows the degree of genome imbalance, defined as the total number of genes that are either gained or lost as a consequence of whole chromosome and segmental aneuploidies (mean ± SEM).
(F) RPE-1 cells were synchronized at the G1/S transition by thymidine treatment. Six hours after Thymidine wash-out, cells were treated with 0.5μM reversine or DMSO (vehicle control) for 12 hours. After drug wash-out, cells were grown for 66 hours (for a total of 72 hours after mitosis) to generate populations of aneuploid dividing cells (aneuploid cycling). Arrested aneuploid cells were generated as described in Figure 1C. The levels of p53, p21 and p16 were determined by Western blot analysis. Actin served as a loading control.
See also Figure S1, S2

