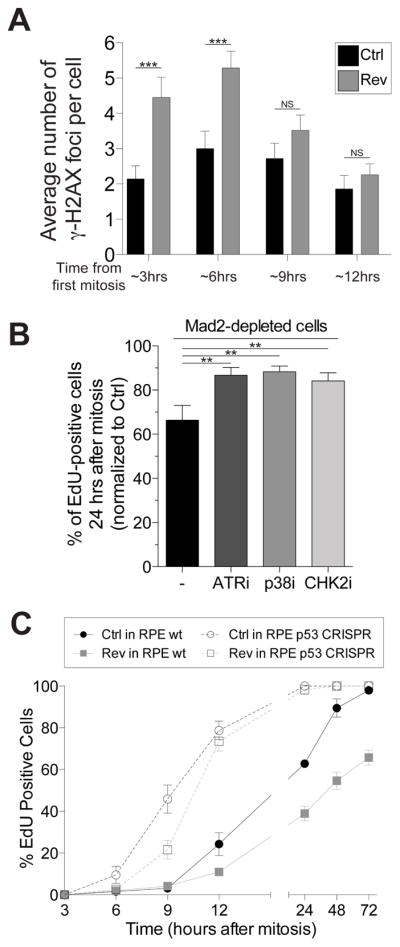
Figure 2. DNA damage incurred during chromosome mis-segregation causes p53 activation.

(A) RPE-1 cells were synchronized at the G1/S transition by thymidine treatment. After Thymidine wash-out, cells were treated with 0.5μM reversine or DMSO (vehicle control). The average number of γ-H2AX foci per cell was determined at the indicated times (mean ± SEM). ***: p value < 0.0001; **; NS: not significant, analysis of variance plus Bonferroni’s test. F test of variance: 3 hour time point: 7.54718E-05; 6 hour time point: 0.002922704
(B) RPE-1 cells were exposed to a single round of siRNA-mediated depletion of Mad2 or control (Ctrl) oligo followed by thymidine arrest. 14h after thymidine wash-out (which corresponds roughly to 2 hours after mitosis), control- and Mad2-depleted cells were exposed to the indicated kinase inhibitors and EdU. The percentage of EdU-positive cells was determined 36 hours after thymidine release (~24 hours after mitosis). The graph shows the percentage of EdU-positive cells normalized to control-depleted cells. The following small molecule inhibitors were used: VE821 (ATR inhibitor, working concentration 1 μM), SB203580 (p38 inhibitor, working concentration 10 μM), Chk2 inhibitor II (Chk2 inhibitor, working concentration 10 μM). Graph shows mean ± SEM. ***: p value < 0.0001, analysis of variance plus Bonferroni’s test.
(C) RPE-1 cells, either wild type for p53 or lacking the tumorsuppressor (p53 CRISPR), were synchronized at the G1/S transition by thymidine treatment. After thymidine wash-out, cells were treated with 0.5 μM reversine or DMSO (vehicle control). 14 hours later, the drug was washed-out and cells were exposed to EdU. Percentage of EdU-positive cells was determined at the indicated times. Graph shows mean ± SEM.
See also Figure S3
