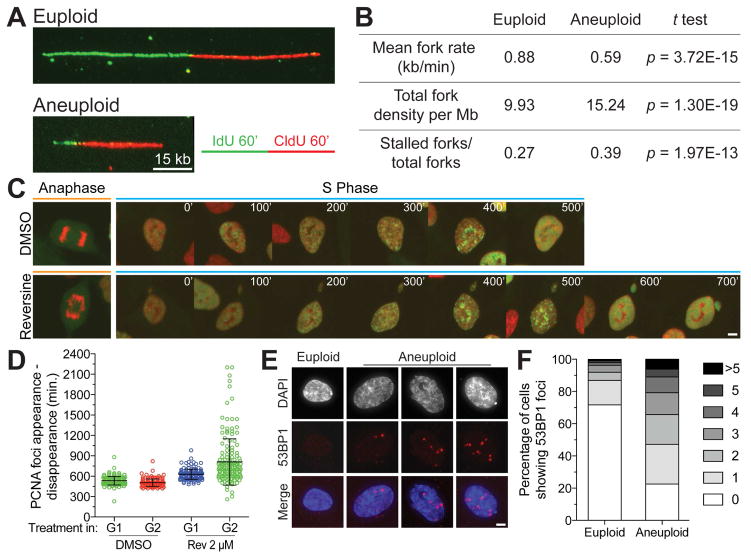
Figure 3. Chromosome mis-segregation causes replication stress.
(A, B) RPE-1 cells were treated with reversine (0.5μM; aneuploid) or vehicle control (euploid) for 24 hours. The inhibitor was then washed out and cells were arrested in G1 by treatment with Mimosine for 24 hours. After Mimosine wash-out, cells were placed into fresh medium and three hours later pulse labeled with IdU (green) for 60 min and chased with CldU (red) for 60 min. Sample fiber images from euploid and aneuploid cells are shown in (A). Fork rate, fork density and fork stall rate are shown in (B).
(C, D) Unsynchronized RPE-1 cells co-expressing PCNA::GFP and RFP::H2B were treated with DMSO or reversine (2 μM), imaged every 5 min for 5 hrs to capture mitotic mis-segregation events, and then imaged every 20 min for 48h to capture daughter cell S phase timing. Representative images of mother cell anaphase and one daughter cell S phase after treatment with DMSO or reversine are shown in (C). Quantification of the time interval from PCNA focus appearance to dissolution, a measure for S phase duration in living cells, is shown in (D). The analysis was performed on daughter cells whose mother cells divided prior to addition of reversine (reversine exposure occurred during G1) and on daughter cells whose mothers mis-segregated chromosomes in the presence of reversine (reversine exposure occurred during G2; mean ± SD). Scale bar 5 μm.
(E, F) RPE-1 cells were treated with 0.5μM reversine or vehicle control for 24 hours. The drug was then washed out and cells were synchronized in G1 using Mimosine for 24 hours. After Mimosine wash-out, cells were placed into fresh medium and 53BP1 foci were analyzed 4 hours later. Representative images (E) and quantification (F) are shown. Scale bar 5 μm.
See also Movie S1

