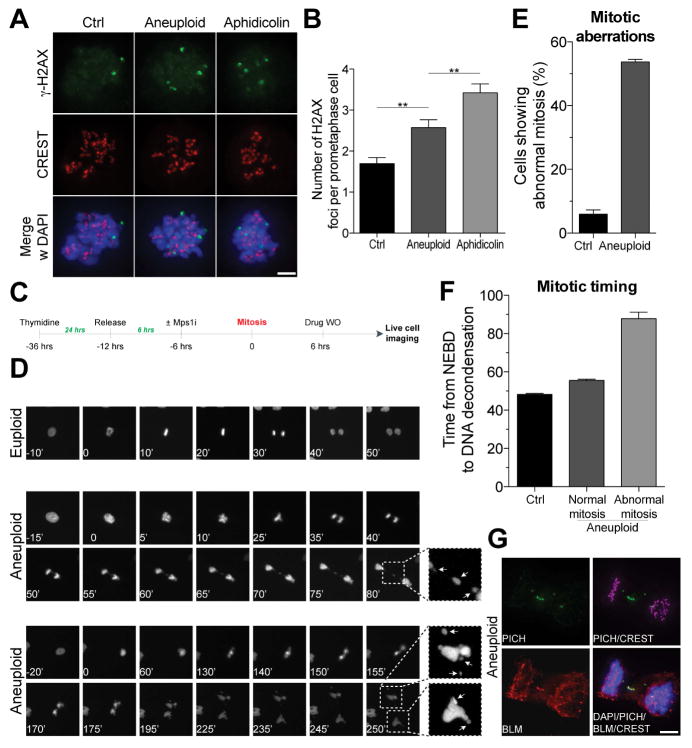
Figure 4. Chromosome mis-segregation results in genomic instability.
(A, B) RPE-1 cells were synchronized at the G1/S transition by thymidine treatment. Six hours after Thymidine release, cells were treated with control vehicle (euploid) or 0.5 μM reversine (aneuploid) for 12 hours. 12 hours after drug wash-out, cells were treated with the CDK1 inhibitor RO-3306 for 12 hours to enrich for G2 cells. Cells were then released in fresh medium containing nocodazole and γ-H2AX foci were analyzed 2 hours later. CREST is used to mark centromeres. As a positive control, cells were treated with aphidicolin 18 hours after thymidine release. Representative images are shown in (A). Quantification of γ-H2AX foci is shown in (B). γ-H2AX is in green, CREST in red, DNA in blue (mean ± SEM). Scale bar 10 μm. **: p value < 0.01, analysis of variance plus Bonferroni’s test.
(C–F) RPE-1 cells stably expressing H2B-GFP were synchronized at the G1/S transition by thymidine treatment. Six hours after thymidine wash-out, cells were treated with control vehicle (euploid) or 0.5 μM reversine (aneuploid) for 12 hours. After drug wash-out, cells were filmed every 5′. Quantification of mitotic aberrations (lagging chromosomes and micronuclei) is shown in (E). Length of mitosis (nuclear envelope breakdown (NEBD) to DNA decondensation) is shown in (F; mean ± SEM).
(G) Cells were grown as described in Figure 4A. After RO-3306 wash-out, cells were released into fresh medium and fixed 90′ later to analyze DNA bridges in anaphase. Representative images of DNA bridges are shown. PICH is in green, BLM in red, CREST in magenta, DNA in blue. Scale bar 10 μm.

