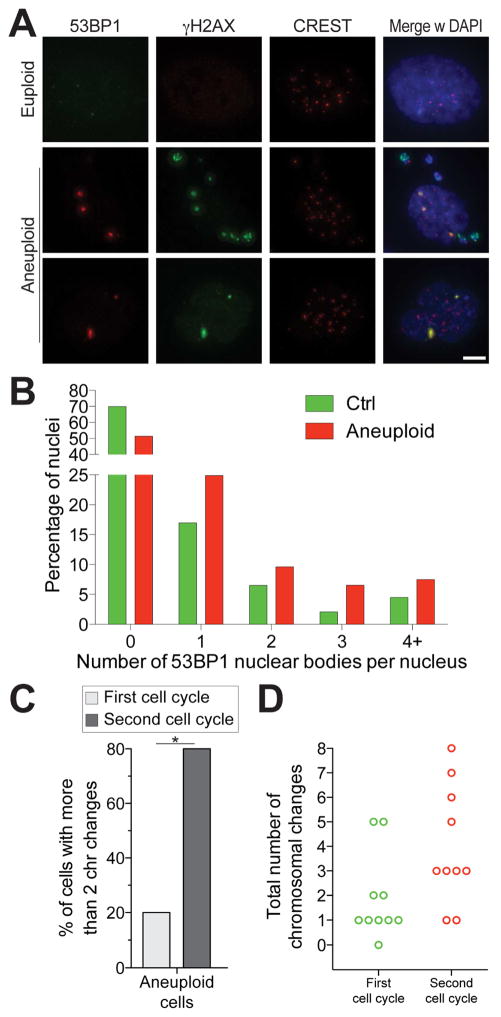
Figure 5. Chromosome mis-segregation triggers the evolution of complex abnormal karyotypes.
(A, B) Cells were grown as described in Figure 4A. After RO-3306 wash-out, cells were released into fresh medium and fixed 6 hours later to analyze 53BP1 foci in the following G1. Representative images are shown. 53BP1 is in red, γ-H2AX in green, CREST in magenta, DNA in blue. Quantification of 53BP1 foci in G1 is shown in (B). Scale bar 5 μm.
(C, D) Karyotype analysis after the first and second cell cycle following chromosome mis-segregation (see Figure S5 for experimental details). The percentage of cells with more than 2 chromosome changes (C) and the total number of chromosomal changes per cell (D) are shown for aneuploid cells after the first and second cell cycle following chromosome mis-segregation. *: p value < 0.05, Student’s t test.
See also Figure S5

