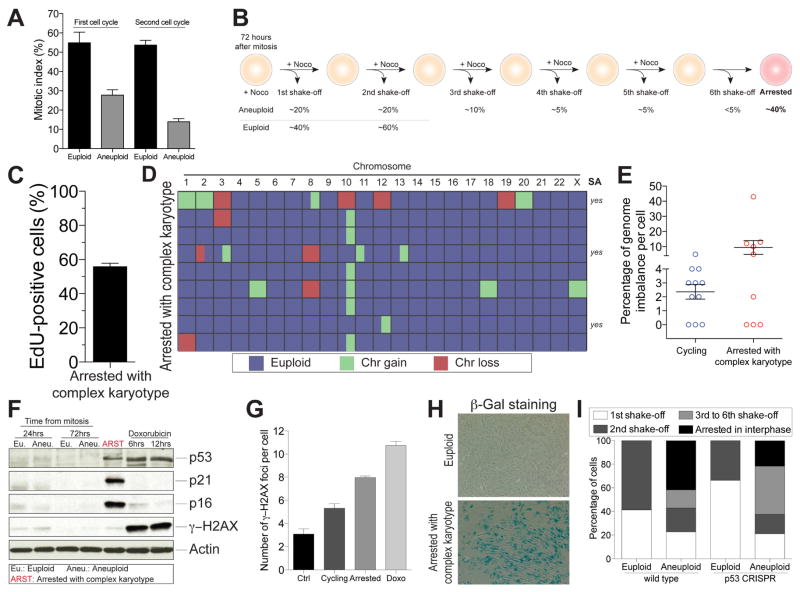
Figure 6. Chromosome mis-segregation causes the generation of cells with complex karyotypes that undergo senescence.
(A) RPE-1 cells were treated with reversine or control vehicle for 24 hours. Cells were exposed for 12 hours to nocodazole either after wash-out or 24 hours later, to determine the ability of cells to enter mitosis during the first or second cell cycle following chromosome mis-segregation (mean ± SEM).
(B) Schematic representation of the experimental method used to isolate arrested cells with complex karyotypes (see STAR methods for details). Shown below the cartoon is the percentage of cells that detached from the plate after each shake-off.
(C) Aneuploid arrested cells were isolated as described in STAR methods. Cells were exposed to EdU after reversine wash-out, plated on coverslips after the fourth nocodazole shake-off and fixed 12 hours later to determine the percentage of EdU-positive cells. Graph shows mean ± SEM.
(D, E) Aneuploid arrested cells were isolated as described in STAR methods and their karyotype determined by single cell sequencing. The heat map of chromosome gains and losses of arrested cells with complex karyotypes is shown in (D). Partially colored boxes represent segmental aneuploidies and are marked as “yes” in the column SA (for segmental aneuploidies). The graph in (E) shows the degree of genome imbalance, defined as the total number of genes that are either gained or lost as a consequence of whole chromosome and segmental aneuploidies (mean ± SEM). The “Cycling” sample is the same as presented in Figure 1E and is comprised of aneuploid cells able to divide.
(F) RPE-1 cells were synchronized at the G1/S transition by thymidine treatment. Six hours after thymidine release, cells were treated with DMSO (euploid) or 0.5 μM reversine (aneuploid) for 12 hours. After wash-out, cells were placed into fresh medium and harvested 18 or 66 hours later, which corresponds to 24 and 72 hours after mitosis, respectively. Arrested cells were obtained as described in Figure 6B. The levels of p53, p21, p16 and γ-H2AX were determined by Western blot analysis. Actin served as a loading control. Euploid cells treated with doxorubicin for 6 or 12 hours were used as positive controls. Euploid and aneuploid samples represent cells that were initially treated with DMSO or 0.5 μM reversine, respectively.
(G) Euploid, aneuploid cycling and aneuploid arrested cells were generated as described in STAR methods. The graph shows the quantification of γ-H2AX foci per cell. Euploid cells treated with doxorubicin for 12 hours were used as a positive control. Graph shows mean ± SEM.
(H) Senescence-associated β-galactosidase (β-gal) activity was determined in euploid cells and arrested cells with complex karyotypes obtained as described in Figure 6B.
(I) The percentage of cycling and arrested euploid or aneuploid RPE-1 cells, either wild type or lacking p53, was determined following the scheme shown in Figure 6B. Graph shows the percentage of arrested cells or cells recovered after the indicated mitotic shake-offs.

