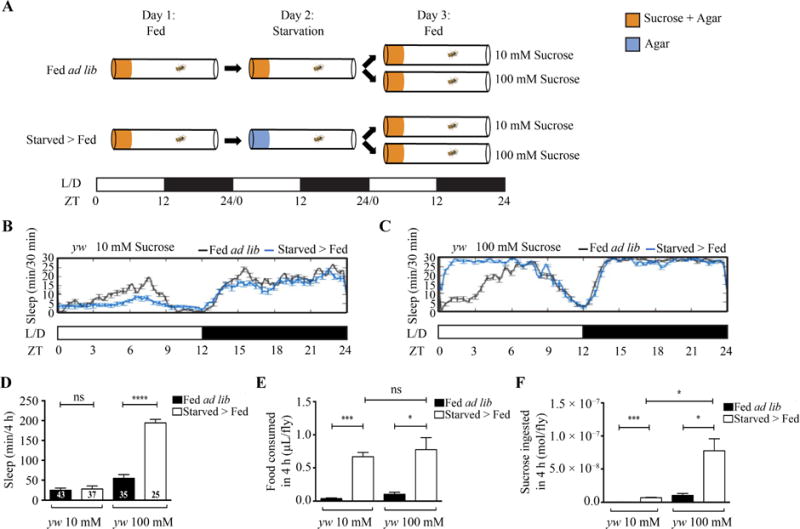
Fig. 5. Lower concentration of sucrose does not drive sleep increase after starvation.

A: Schematic of experimental setup. Two groups of adult flies were placed into Drosophila Activity Monitor tubes with medium containing 5% sucrose and 2% agar on day 1. One group of flies were fed ad libitum throughout the experiment. The other group of flies were transferred onto medium containing 1% agar for starvation on day 2 and then transferred back onto medium containing 2% agar and 10 mM or 100 mM sucrose. The fed ad lib flies were also transferred onto medium containing 2% agar and 10 mM or 100 mM sucrose as controls. Sleep was tracked throughout the experiment. B: Sleep profile of fed ad lib (n = 12) and starved > fed (n = 14) yw flies on 10 mM sucrose medium. C: Sleep profile of fed ad lib (n = 12) and starved > fed (n = 16) yw flies on 100 mM sucrose medium. D: Quantification of sleep differences between the 4-h fed ad lib and starved > fed yw flies. The starved > fed yw flies increased sleep on 100 mM sucrose medium (P < 0.0001) but not on 10 mM sucrose medium (P = 0.7278) compared to their relevant fed ad lib controls. E: Quantification of food intake for 4 h in fed ad lib or starved > fed yw flies (fed ad lib on 10 mM sucrose, N = 3; starved > fed on 10 mM sucrose, N = 4; fed ad lib on 100 mM sucrose, N= 4; starved > fed on 100 mM sucrose, N = 5). Sucrose intake was significantly higher in starved > fed yw flies compared to fed ad lib yw flies on both 10 mM (P = 0.0004) and 100 mM sucrose solution P < 0.0141). No difference was observed between starved > fed yw flies on 10 mM and 100 mM sucrose solution (P = 0.6311). F: Quantification of sucrose ingested for 4 h in fed ad lib and starved > fed yw flies (fed ad lib on 10 mM sucrose, N = 3; starved > fed on 10 mM sucrose, N = 4; fed ad lib on 100 mM sucrose, N= 4; starved > fed on 100 mM sucrose, N = 5). Sucrose intake was significantly higher in starved > fed yw flies compared to fed ad lib yw flies on both 10 mM (P = 0.0004) and 100 mM sucrose solution (P < 0.0141). Sucrose intake was higher in starved > fed flies on 100 mM sucrose solution compared to those on 10 mM sucrose solution (P = 0.0107). N represents the amount of experiments performed.
