
Figure 2. Scf was highly expressed by LepR+ stromal cells and adipocytes in the bone marrow before and after irradiation.
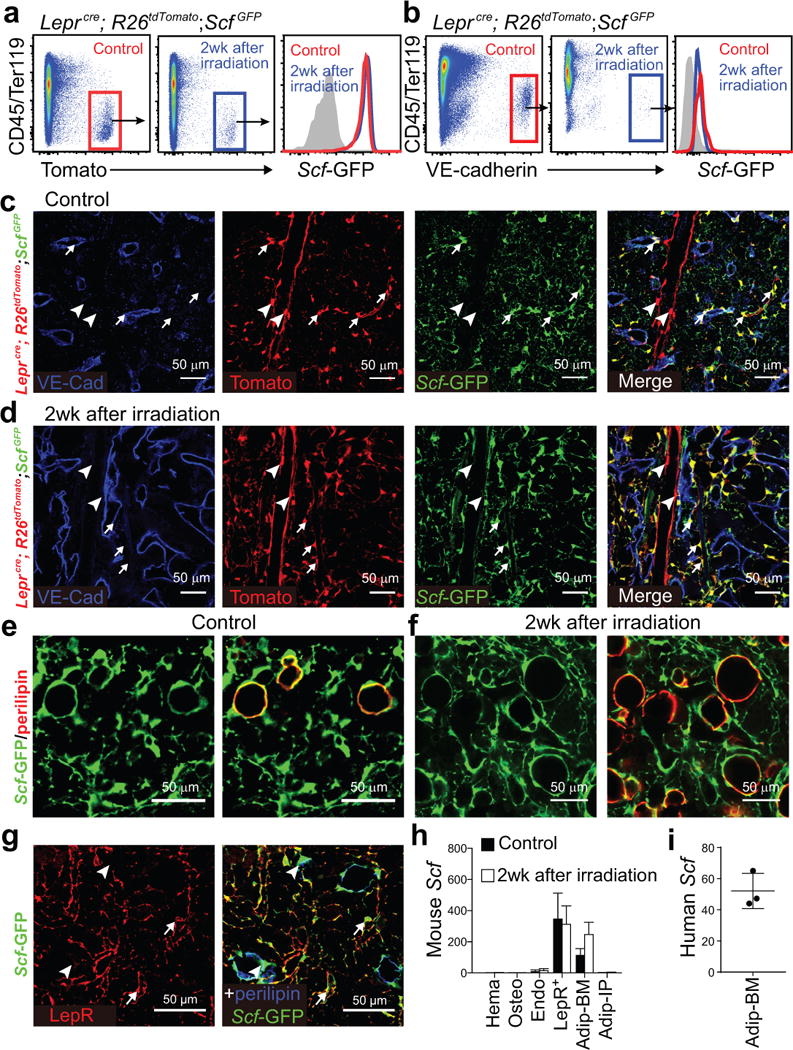
One million whole bone marrow cells from wild-type mice were transplanted into irradiated Leprcre; R26tdTomato; ScfGFP (a-d) or ScfGFP (e, f) mice.
(a, b) Flow cytometric analysis of enzymatically dissociated bone marrow cells from Leprcre; R26tdTomato; ScfGFP mice showed that Scf-GFP was expressed at a high level by LepR+ stromal cells (a) and at a low level by endothelial cells (b) in non-irradiated mice (Control) and at 2 weeks after irradiation and bone marrow transplantation (representative results from 3 independent experiments).
(c, d) Representative femur diaphysis sections showed Scf-GFP expression by Tomato+ stromal cells in the bone marrow of Leprcre; R26tdTomato; ScfGFP mice that were not irradiated (Control, c) or at 2 weeks after irradiation and bone marrow transplantation (d). Tomato+ cells around small arterioles and sinusoids (arrows) expressed Scf-GFP while Tomato+ cells around large arterioles (arrowheads) did not (representative results from 3 independent experiments).
(e, f) Representative femur metaphysis sections showed Scf-GFP expression by perilipin+ adipocytes in non-irradiated mice (Control, e) and at 2 weeks after irradiation and bone marrow transplantation (f) (representative results from 6 independent experiments). Note that the subcellular distribution of perilipin and GFP differ. See Supplementary Fig. 2e for serial optical sections showing Scf-GFP expression by a periliplin+ adipocyte.
(g) Confocal imaging of thin femur sections from non-irradiated ScfGFP mice co-stained with anti-LepR and anti-perilipin antibodies. LepR+ cells were Scf-GFP+ but perilipin negative (arrows). Perilipin+ cells were Scf-GFP+ but LepR negative (arrowheads; representative results from 3 independent experiments).
(h, i) Quantitative RT-PCR analysis of Scf transcript levels (normalized to β-Actin) in CD45+/Ter119+ hematopoietic cells (Hema), Col1a1*2.3-GFP+ osteoblasts (Osteo), VE-cadherin+ endothelial cells (Endo), Tomato+CD45−Ter119− bone marrow stromal cells from Leprcre; R26tdTomato mice (LepR+), bone marrow adipocytes (Adip-BM) and intraperitoneal adipocytes (Adip-IP) relative to unfractionated bone marrow cells in mouse (h) and human bone marrow (i). The Scf transcript level in unfractionated bone marrow cells was normalized to 1. Data represent mean±SD (n=3 mice (h) and n=3 human (i) samples, each from 3 independent experiments).